 |
Stratospheric Processes And their Role in Climate
|
||||||||
| Home | Initiatives | Organisation | Publications | Meetings | Acronyms and Abbreviations | Useful Links |
![]()
 |
Stratospheric Processes And their Role in Climate
|
||||||||
| Home | Initiatives | Organisation | Publications | Meetings | Acronyms and Abbreviations | Useful Links |
![]()
Report on the 1st WG 1 Expert Meeting on the LAUTLOS Campaign at Lindenberg
August 24-27, 2004
Ulrich Leiterer, German Weather Service, Meteorological Observatory Lindenberg, Germany (ulrich.leiterer@dwd.de)
Vladimir Yuskov, Central Aerological Observatory Moscow, Russia (vladimir@caomsk.mipt.ru)
Roland Neuber, Alfred Wegener Institute for Polar and Marine Research Potsdam, Germany (neuber@awi-potsdam.de)
Paul Ruppert, Meteolabor AG, Switzerland (paul.ruppert@meteolabor.ch)
Ari Paukkunen, Vaisala Oyj, Helsinki, Finland (Ari.Paukkunen@vaisala.com)
Esko Kyrö, Arctic Research Centre (FMI/ARC), Sodankylä, Finland (esko.kyro@fmi.fi)
Beat Duber, Institute of Applied Physics, University of Bern, Switzerland
The LAUTLOS field campaign was
hosted by the FMI Arctic Research
Centre, Sodankylä, and was assisted
by Vaisala. It was successfully conducted in
January and February of 2004. The purpose
of LAUTLOS-WAVVAP (LAPBIAT
Upper Troposphere Lower Stratosphere
Water Vapour Validation Project) is the
comparison and validation of the world’s
best hygrometers that are usable as
research-type radiosondes for precise
water vapour measurements in the troposphere
and stratosphere (up to 10 hPa),
and to improve and validate these
hygrometers and radiosondes. The instruments
used in the study included the
Meteolabor Snow White hygrometer, the
NOAA frostpoint hygrometer, the CAO
Flash Lyman-alpha hygrometer, the
Lindenberg FN sonde, and Vaisala’s latest
RS92 GPS-version. The aim is to define an
optimal working range in temperature,
water vapour mixing ratio, relative humidity,
and pressure for each of the participating
hygrometers/radiosondes. In addition
to the balloon-borne instruments, the
University of Bern operated its ground
based 22 GHz microwave instrument,
MIAWARA, at Sodankylä to obtain water
vapour profiles from approximately 25 to
70 km. A further microwave radiometer
was operated from a LearJet of the Swiss
Air Force to obtain water vapour profiles
close to the balloon locations. The field
campaign consisted of 30 balloon flights
carrying integrated payloads.
The WG1 expert meeting was sponsored by COST 723 (see home page http://www.cost723.org/meetings/wg1_2) and co-sponsored by SPARC. At the meeting, the principal investigators reported on the status of the data archiving and the evaluation process. The participants discussed the results obtained during the campaign, the details of the comparison procedures, and possible future publications. The LAUTLOS data archive consists of vertical profiles from 9 different systems.
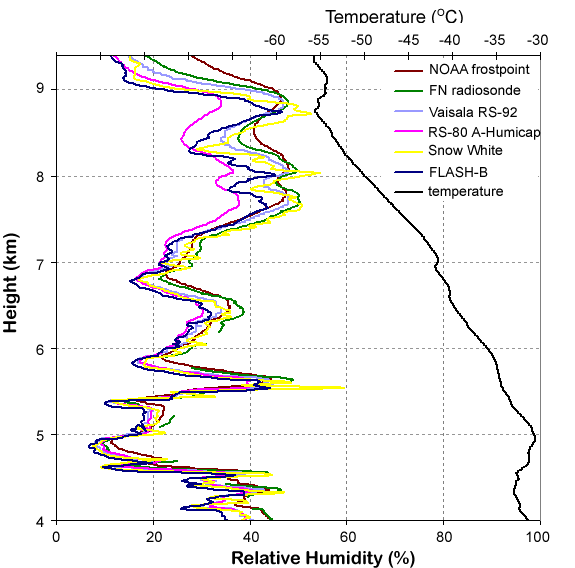
Figure 1 (see colour insert I) shows a comparison of relative humidity measured by different humidity sondes during balloon ascent. As seen from the plot, the sondes are generally in good agreement with each other and do not reveal significant biases. The temperature profile taken by the Vaisala RS-80 temperature sensor is also shown on the plot in order to demonstrate the sondes relative performance at different temperatures.
 |
Figure 1: Simultaneous humidity measurements of the tropospheric water vapour content by 6 different instruments (NOAA/CMDL frostpoint hygrometer, DWD FN-method radiosonde, Vaisala RS-92, Vaisala RS-80 A-Humicap, Meteolabor Snow White chilled mirror hygrometer, and CAO Lyman-alpha FLASH-B hygrometer) during balloon ascent on 11 February 2004, Sodankylä, Finland, and the temperature profile measured by the Vaisala RS-80 temperature sensor (top axis).
For better resolution, please contact the SPARC Office. |
During the LAUTLOS campaign, 11 water
vapour profiles were obtained using the FLASH-B instrument; among them four
inside the polar vortex, four on the edge of
the vortex, and three outside the vortex.
The polar vortex during this time period
(February 2004) appeared to be relatively
weak, with generally warm temperatures.
Therefore it is assumed that no PSCs
formed for the duration of the campaign.
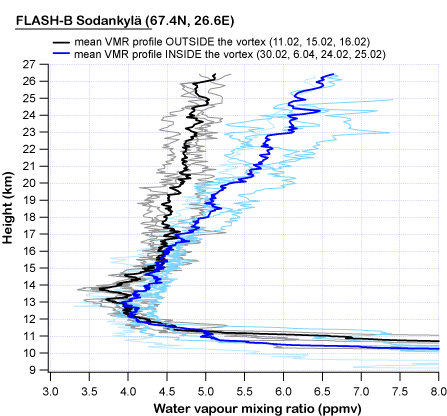
Figure 2 shows the calculated mean water vapour profile both inside and outside the polar vortex using the FLASH-B measurements, which appear to be in a good agreement with those obtained by the NOAA frost point hygrometer (see Figure 3). The profiles obtained inside the vortex clearly show higher water vapour values than those taken outside the vortex. This is caused by the fact that the water vapour mixing ratio in the stratosphere increases with height through the oxidation of methane. Thus, downwelling air motion in the vortex (diabatic descent) leads to higher water vapour content inside the vortex, compared to that outside the vortex at the same altitude. The difference reaches 1.4 ppmv at 25 km altitude. Since the FLASH-B water vapour measurements are in good agreement with the other independent sensors, the calculated mean water vapour profiles can be considered as a reference for the Arctic stratosphere over Sodankylä in February with the moderate-strength vortex.
 |
Figure 2: Mean water vapour profiles inside (thick blue) and outside (thick black) the polar vortex calculated using the measurements made by the the FLASH-B hygrometer during the LAUTLOS campaign (January 29 – February 27). Thin blue and black lines on the plot indicate the profiles obtained inside the vortex (flights on 30.01, 6.02, 24.02, 25.02.2004) and outside the vortex (flights on 11.02, 15.02, 16.02.2004).
For better resolution, please contact the SPARC Office. |
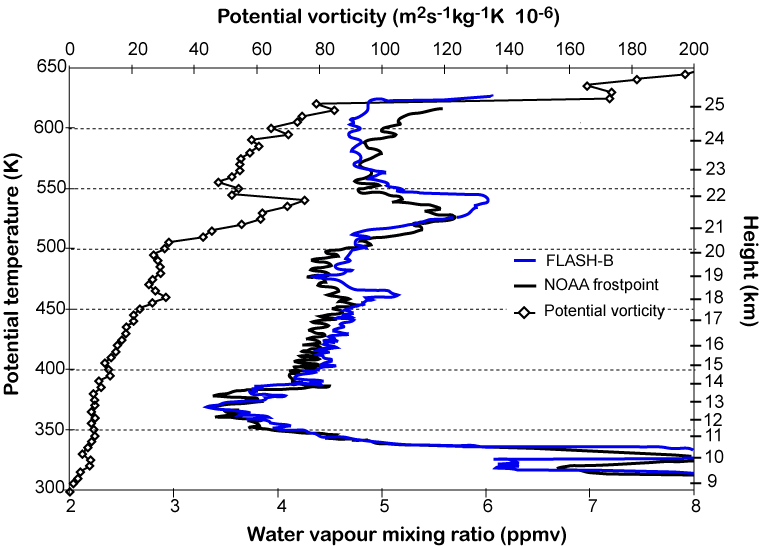
The water vapour profiles obtained by the FLASH-B and NOAA frostpoint hygrometers at the edge of polar vortex on 17 February are shown in Figure 3. The profiles indicate some filamentary structure, which can be explained by differential advection of air masses originating from inside and outside the vortex. This is confirmed by a calculation of potential vorticity from a back-trajectory analysis performed using ECMWF operational data. The laminae are captured well by both hygrometers.
 |
Figure 3: Vertical water vapour profiles measured by FLASH-B (blue) and NOAA (black) hygrometers at the edge of the polar vortex on 17 February, and the potential vorticity profile obtained from back-trajectory analysis. Potential temperature and estimated height are shown on the vertical axis. Laminae at approximately 22 km and 18 km seen in the potential vorticity profile are also captured by both the FLASH-B and NOAA frostpoint hygrometers.
For better resolution, please contact the SPARC Office. |
The stratospheric water vapour mixing ratio inside, outside, and at the edge of the polar vortex has been accurately measured. The large dry bias in Arctic stratospheric water vapour typically found in models implies the need for future regular measurements of water vapour in the polar stratosphere to allow for validation and improvement of climate models. The numerous comparisons are now in progress and results are due by May 2005. All data are available in FMIARC ftp-server for the participants. The LAUTLOS database will be free for all interested scientists after May 31, 2005.
It was proposed that the 2nd LAUTLOS data evaluation meeting be held in Finland from August 29 to September 03, 2005.
![]()