|
Stratospheric Processes And their Role in Climate
|
||||||||
| Home | Initiatives | Organisation | Publications | Meetings | Acronyms and Abbreviations | Useful Links |
![]()
|
Stratospheric Processes And their Role in Climate
|
||||||||
| Home | Initiatives | Organisation | Publications | Meetings | Acronyms and Abbreviations | Useful Links |
![]()
Aspects of Modelling and Assimilation for the Stratosphere at ECMWF
Antje Dethof, ECMWF, Reading, UK (Antje.Dethof@ecmwf.int)
1. Introduction
The ECMWF model is a global spectral model with a horizontal truncation of T511, corresponding to about 40 km grid spacing. In its current form the model has 60 levels in the vertical, 25 of which are above 100 hPa. The model top is at 0.1 hPa, corresponding to about 65 km. The model has a hybrid vertical coordinate, with terrain following coordinates in the lower troposphere and pressure coordinates in the stratosphere above about 70 hPa. The operational model uses a 4D variational analysis scheme to assimilate observations in 12 hourly intervals.
The main developments that led to a better representation of the stratosphere in the ECMWF model and analysis system took place in the last four years. In March 1999 the model top was raised from 10 hPa to 0.1 hPa, and the number of vertical model levels was increased from 31 to 50 [Untch et al., 1999]. The additional levels were all added above 150 hPa. In October 1999 the vertical resolution was further increased to give the current 60 level version. This time most of the new levels were added in the boundary layer. The raising of the model top and the increased vertical resolution in the stratosphere meant that stratospheric processes could now be better represented in the ECMWF system and led to improved analyses and forecasts in the stratosphere. It also gave scope for further developments. A simple parameterization of stratospheric methane oxidation was included in the model [Simmons pers. comm. http://ifsdoc.ecmwf.int/html/rd/cy26r1/ifs/documentation/PHYSICS/ Cha1_Oveview.html) to improve the stratospheric water vapour distribution. Ozone was added as a model variable and an ozone chemistry parameterization was included. Finally, ozone was included in the data assimilation system [Hólm et al., 1999]. This 60 level version of the model was used in the ECMWF re-analysis ERA-40 project that covers the years from 1957 to 2002 [Simmons and Gibson, 2000].
2. Ozone model and analysis
Ozone is fully integrated into the ECMWF forecast model and analysis system as an additional 3D-model and analysis variable. The ECMWF ozone assimilation system allows the assimilation of ozone retrievals in the form of ozone layers in 3D-VAR or 4D-VAR. Since April 2002, ozone layers from the SBUV/2 instrument on NOAA-16 and total column ozone retrievals from GOME on ERS-2 (provided by KNMI's Fast Delivery Service) have been assimilated in the operational ECMWF system. In the ERA-40 project, retrievals from TOMS and SBUV instruments on various satellites are assimilated in 3D-VAR with a horizontal truncation of T159 (about 125 km grid spacing) from December 1978 onwards. No ozone data is assimilated in ERA-40 during 1989 and 1990 for technical reasons.
2.1 Model
The ECMWF forecast model includes a prognostic equation for the ozone mass mixing ratio O3[kg/kg]
where RO3 is a parameterization of sources and sinks of ozone. Without such a source/sink parameterization the ozone distribution would drift to unrealistic values in integrations longer than a few weeks.
The parameterization used in the ECMWF model is an updated version of Cariolle and Déqué (1986), which has been used in the ARPEGE climate model at Météo-France. This parameterization assumes that chemical changes in ozone can be described by a linear relaxation towards a photochemical equilibrium. It is mainly a stratospheric parameterization. The relaxation rates and the equilibrium values have been determined from a photochemical model, including a representation of the heterogeneous ozone hole chemistry. The updated version of the parameterization (with coefficients provided by P. Simon, Météo-France) is
where
Here ci are the relaxation rates and
,
and
are photochemical equilibrium values, all functions of latitude, pressure and month.
ClEQ is the equivalent chlorine content of the stratosphere for the actual year and is the only parameter that varies from year to year. For the ECMWF model it was necessary to replace the photochemical equilibrium values for ozone with an ozone climatology derived from observations [Fortuin and Langematz, 1995]. The heterogeneous term c4 (ClEQ)2 O3 is only turned on in daylight and below a threshold temperature of 195 K.2.2 Analysis
In the ECMWF analysis system there is no separate ozone analysis, but ozone is analysed simultaneously with all the other analysis variables in the 3D-VAR or 4D-VAR system. Ozone is analysed univariately at present, which means that the analysis increments of ozone and other variables are assumed to be uncorrelated. The univariate treatment was chosen to prevent ozone sensitive observations from directly changing any variable other than ozone, while the assimilation of ozone data is being further developed and improved. For similar reasons, model ozone is not used directly in the radiation calculations of the forecast model, where the ozone climatology of Fortuin and Langematz (1995) is used instead. The only way ozone can affect the dynamics in 3D-VAR is through the use of the model ozone in the radiance observation operators. In the ECMWF model/analysis configuration this is a weak feedback, which should mostly improve the usage of radiance observations. In 4D-VAR ozone affects the dynamics through the adjoint integrations, even if the ozone analysis is univariate.In the ECMWF assimilation system retrievals in the form of ozone layers or partial columns (unit kgm-2) are assimilated, not ozone profile points. The main difficulty with the assimilation of retrieved ozone data, which are given as vertically integrated layers spanning several model levels (e.g. TOMS, GOME and SBUV retrievals), is how to distribute the analysis increments in the vertical. This distribution is controlled by the background error covariance matrix of the ECMWF assimilation system. The vertical covariances directly determine the weights with which the layer increment is spread in the vertical and, hence, the shape of the resulting analysis increment profile. The ozone background error covariances used in the ECMWF system were determined statistically from an ensemble of analysis experiments. The observations used in each analysis were perturbed randomly according to the observation error. Differences between the background fields valid at the same time, but from different experiments, are taken to be representative of the background error and give fields from which the background error statistics can be calculated [Anderson and Fisher, 2000].
2.3. Validation of the ECMWF ozone field
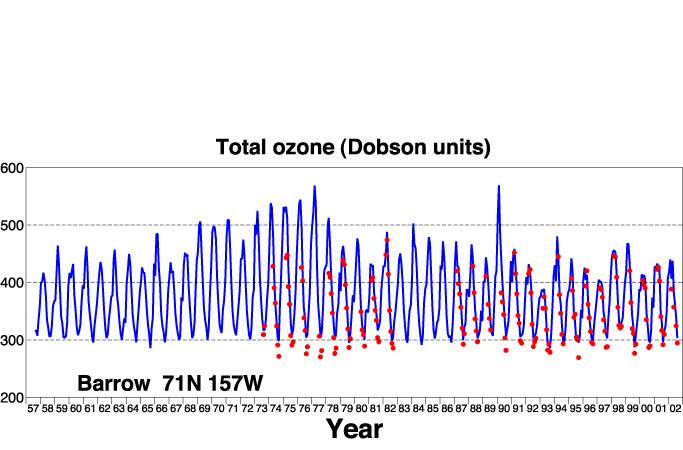
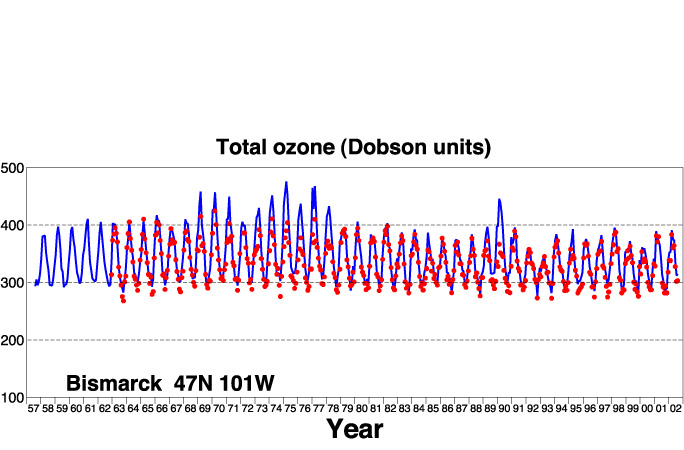
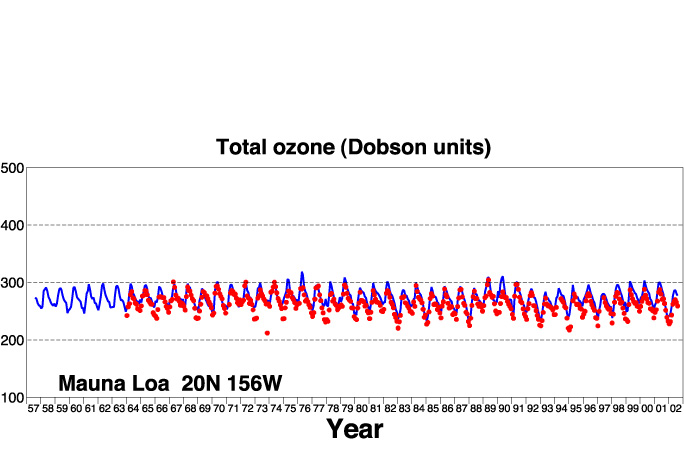
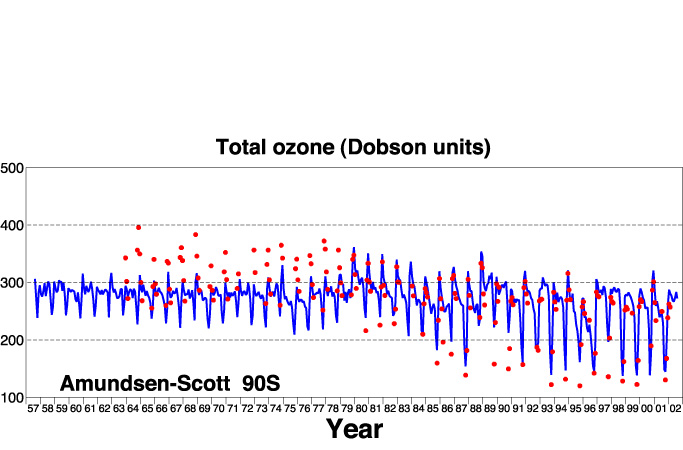
To validate the ECMWF ozone analysis, analysed ozone fields are compared with independent observations that were not used in the assimilation, concentrating on the total column ozone fields from ERA-40. Figure 1 shows a timeseries of monthly mean ERA-40 ozone values in Dobson Units (DU) and ground based total ozone from four stations for the whole ERA-40 period from 1957 to 2002. We see good agreement for those years when TOMS and SBUV data are assimilated (1979-1988; 1991-2002, though with some gaps in coverage). There are some biases, e.g. the minima are not low enough at Barrow and Bismarck and values are slightly too low at Mauna Loa. Also the ozone hole is not quite deep enough at the South Pole in October, but the trend toward lower total ozone values at the South Pole during the 1980s is well captured.
Figure 1 Timeseries of monthly mean total ozone in DU from independent ground based observations (red dots) and ERA-40 (blue curve) for the stations Barrow, Bismarck, Mauna Loa, and Amundsen-Scott. [Figure provided by A. Simmons, following similar calculations by P. Simon]
For the pre-1979 period, when no ozone data were assimilated, ERA-40 total ozone is also reasonable during many of the years, but some larger biases can be seen. Bismarck and Barrow have a good annual cycle in the years prior to 1972 when no satellite data of any sort are assimilated in ERA-40. From 1973 to 1978 data from the Vertical Temperature Profiler Radiometer (VTPR) are assimilated into the ERA-40 system. Too high late-winter values are seen during those years when no other ozone data but VTPR data are assimilated. The same can be seen in 1989 and 1990, when no other ozone data but TOVS-1b data are assimilated. This suggests that the assimilation of these satellite data might upset the Brewer-Dobson circulation, possibly either through a forcing due to the strong convection excited in the tropical troposphere due to the spin-up problem or through a forcing caused by correcting biases in the upper stratosphere. The effect of this on ozone is to be masked when TOMS and SBUV data are assimilated. The timeseries for tropical station at Mauna Loa is very similar in the pre-1979 period to the later years.
The most noticeable difference between ERA-40 ozone and the ground based observations prior to 1979 is seen at the South Pole, where total ozone in ERA-40 is underestimated in many months. The equivalent chlorine loading, which determines the strength of the heterogeneous term in the chemistry parameterization (see Equation 2) is smaller during the earlier years of ERA-40 than in later years, but it is not zero. Comparisons with ozone sondes from Amundsen-Scott during the 1960s show that ERA-40 ozone values are considerably lower than the sonde values below the ozone maximum of the profiles (not shown). ERA-40 temperatures (in these years prior to the assimilation of satellite radiance data) are about 30 K lower at these altitudes than the sonde temperatures at Amundsen-Scott during October, and considerably below the temperature threshold for PSC formation. At these temperatures the heterogeneous term in Equation 2 is active and some of the ozone is depleted in an 'ozone hole-like' manner in ERA-40 during these early years. During the rest of the year, the ozone maximum at the South Pole is located at higher altitude in ERA-40 than in the observations, and ozone values below the maximum are too low, resulting in a lower total column value. It is possible that the ozone climatology used in the ECMWF system is not appropriate for South Pole conditions during the early years.
During the later years of ERA-40, the PSC term in the ozone chemistry is not quite strong enough to produce a deep enough ozone hole if no ozone data are assimilated.
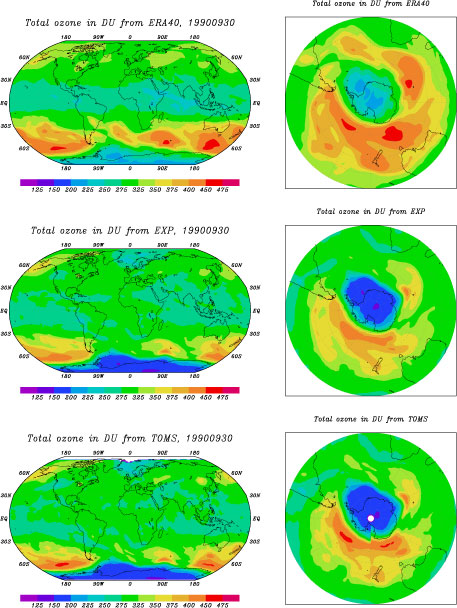
When ozone data are assimilated the total column ozone field is much improved. This is illustrated in Figure 2, which shows the total ozone field in DU on 30 September 1990 from ERA-40 (top panel; no ozone observations were assimilated in 1989 and 1990), the total ozone field for the same day from an experiment, which uses the ERA-40 configuration and in which TOMS and SBUV ozone observations are assimilated (middle panel), and TOMS data (bottom panel).
Figure 2 Total column ozone in DU on 30 September 1990: from the ERA-40 production in which no ozone observations are assimilated at this time (top), from an experiment which uses the ERA-40 configuration and in which TOMS total column ozone and SBUV ozone layers are assimilated (middle), and from gridded daily TOMS data (bottom).
The ECMWF total ozone field shows a bias relative to independent observations that varies depending on the time of year and the geographical location. Generally, the model overestimates total column ozone in the extratropics and underestimates it in the tropics. The positive bias is largest at high latitudes in the NH during winter and spring. There are signs that the Brewer-Dobson circulation in the ECMWF analyses is too strong, and the ozone bias might be a result of transport problems.
While the assimilation of total column ozone data clearly improves the ECMWF total ozone field, a bias between the model and the data can lead to problems in the vertical distribution of ozone in the analysis. Problems arise from having to distribute large total column analysis increments in the vertical. The way the analysis increments are distributed in the vertical is determined by the background error covariance matrix of the ECMWF analysis system. The covariances for ozone originally used in the ECMWF system (and used in ERA-40 from 1991 to October 1996) had anti-correlations between the stratosphere and the troposphere. In situations where the analysis increments were large, the increments were distributed in the vertical in such a way that they caused an almost complete depletion of ozone in the UT/LS and an overestimation of ozone in the lower troposphere [Dethof and Hólm, 2002]. When this problem was noticed, the ozone covariances were modified, and the anti-correlations between the stratosphere and the troposphere removed. The modified covariances are currently used in the operational system, and they were used in ERA-40 between October 1996 and August 2002, and also from the beginning of the ozone assimilation in December 1978 until 1989. With the new covariances the analysis increments are more confined in the vertical and there are no anti-correlations between the stratosphere and the troposphere, or between levels at and above the stratospheric ozone maximum. While this improves the profiles in the troposphere and lower stratosphere, the ozone maximum can be reduced too much in situations where the analysis increment is large and negative.
Work is under way to improve the vertical structure of the analysed ozone field. Several aspects have to be considered here. First, a better representation of the ozone background error covariances is needed. Alternative ways to represent ozone in the analysis (such as normalised quantities) will be explored. Secondly, the bias between the data and the model has to be removed. This problem is two-fold because both the data and the model can have biases. Work is required to understand the reason for the model bias and how to reduce it. Biases in the data will be corrected by implementing a bias correction scheme for ozone data, which makes use of independent ground based observations.
3. Stratospheric humidity
Accurate simulation of water vapour in the stratosphere is one of the most challenging issues for a general circulation model. The accurate representation of the low humidity entering the stratosphere in the tropics depends on several factors, including convection, condensation processes, the large scale circulation and radiative processes that determine the tropopause temperature. A good representation of water vapour in the stratosphere requires a realistic calculation of the upward transport in the tropics, mixing into the extra tropics and descent at high latitudes. Furthermore, a reasonable representation of the upper stratospheric moisture source due to methane oxidation and mixing across the extratropical troposphere is needed.
In the ECMWF analysis system no humidity data are assimilated in the stratosphere at present and there are no humidity increments in the stratosphere. The background humidity provides the initial stratospheric analysis for the next forecast, except in areas of supersaturation caused by a reduction of the temperatures by the analysis, where the supersaturation is removed. Thus, the stratospheric humidity largely evolves according to the model's dynamics and the parameterization of physical processes (for more information see Simmons et al., 1999).
A new humidity analysis scheme is being developed at ECMWF [Hólm et al., 2002]. A global humidity analysis is difficult because humidity values decrease by several orders of magnitude between the troposphere and the stratosphere. To carry out a tropospheric and stratospheric humidity analysis at the same time, a normalized control variable is required. In the troposphere, specific humidity and temperature are highly correlated and a relative humidity-based control variable is necessary. For the low relative humidities in the stratosphere, specific humidity and temperature background errors are not correlated, but transport processes are much more important for the humidity distribution. Here an analysis based on specific humidity as control variable is appropriate. Such a system is currently undergoing testing at ECMWF and will be implemented in the next model update.
3.1Methane oxidation and photolysis in the mesosphere
The ECMWF model includes a simple parameterization of the moisture source by methane oxidation in the upper stratosphere [Simmons pers. comm.], as well as a sink representing the photolysis of water vapour in the mesosphere. Before this parameterization was included, humidity values in the upper tropical stratosphere and in much of the extratropical stratosphere were too low [Simmons et al., 1999].Methane is produced by natural and anthropogenic sources at the Earth's surface. It is well mixed in the troposphere and it is carried upwards in the tropical stratosphere. It decreases in relative density (due to oxidation) from tropospheric values of about 1.7 ppmv to values of around 0.2-0.4 ppmv around the stratopause. Mean stratospheric descent at higher latitudes leads to relatively low values of methane in the extratropical middle and lower stratosphere.
There is observational evidence that over much of the stratosphere the quantity
is relatively uniformly distributed. Based on values reported by Jones et al. (1986) and Bithell et al. (1994), a value of 6 ppmv was assumed for this sum in the original ECMWF implementation of the parameterization and for ERA-40. The operational ECMWF parameterization currently uses a value of 6.8 ppmv based on Randel et al.’s (1998) UARS climatology. The rate of increase in the volume mixing ratio of water vapour (in ppmv) due to methane oxidation is currently calculated in the ECMWF model as
The rate k1 is given by a simple analytical form that varies only with pressure.
The effect of photolysis of water vapour in the mesosphere is included in the parameterization as a simple sink term at heights above 60 km. In this case the full source/sink term becomes
Like k1, the rate k2 is given by an analytical form that varies only with pressure.
3.2 Validation of the ECMWF stratospheric humidity
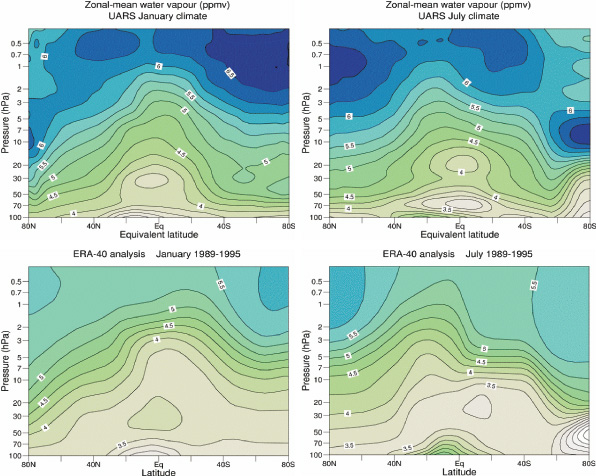
With this simple parameterization ERA-40 has a reasonable stratospheric humidity distribution, but shows a dry bias compared to observations. Figure 3 shows the zonal mean stratospheric water vapour distribution from ERA-40 compared to the UARS climatology for the years 1989-1995. ERA-40 values are about 10-15 % drier than UARS in the upper stratosphere and lower mesosphere, except near the winter stratopause where the model lacks the resolution to represent correctly the descent of drier air from the mesosphere. It was these generally drier upper stratospheric and lower mesospheric values that led to the operational increase in the equilibrium values from 6 to 6.8 ppmv used in the parameterization of methane oxidation.
Figure 3 Upper: Monthly-mean distribution of the mixing ratio of water vapour (ppmv) as a function of pressure and potential vorticity (expressed as equivalent latitude), based on UARS (HALOE, supplemented by MLS) data analyses by Randel et al. (1998). Lower: Monthly-mean distribution of the mixing ratio of water vapour (ppmv) as a function of pressure and latitude derived from ERA-40 analysis for the years 1989-1995. January (left-hand panels) and July ( right-hand panels). [Figure provided by A. Simmons]
In the lower stratosphere there is a too rapid upward progression of the annual cycle of drying and moistening in the tropics in ERA-40 (and in ECMWF's operational analyses). This upward progression in data assimilation cycles is considerably faster than in free-running model simulations, indicative again of a too strong Brewer-Dobson circulation in the assimilating model.
4. Outlook
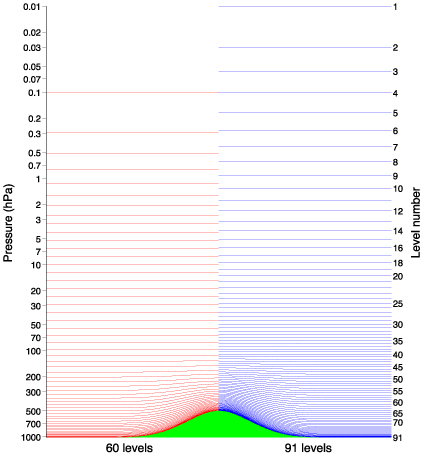
It is planned to further increase the vertical resolution of the ECMWF model from 60 to 91 levels in 2004. The tropopause region will benefit most from the resolution increase, with a doubling in resolution near 100 hPa (from about 1 km to 0.5 km), but almost everywhere in the model domain the vertical resolution will be increased. The model top will be raised from 0.1 hPa to 0.01 hPa (about 80 km). Figure 4 shows the level distribution for the current 60-level model and the future 91-level version. The increase in vertical resolution is laying the foundation for improvements in modelling and assimilation around the tropopause and in the upper stratosphere. Here the current model has deficiencies, and it is hoped that a higher vertical resolution will lead to a better vertical tracer transport in the stratosphere and improved stratosphere-troposphere exchange.
Figure 4. Distribution of the full-model levels, at which wind, temperature, humidity and
ozone are represented, for the current 60-level (left) and the future 91-level (right) vertical
resolution. [Figure provided by A.Untch].The representation of the stratosphere in the ECMWF system will be further improved by the implementation of the new humidity analysis in the ECMWF system. This will enable us to assimilate humidity data in the stratosphere and should lead to a better stratospheric humidity field in the ECMWF analyses.
Further improvements are planned for the ozone assimilation. With its relatively simple ozone chemistry parameterization the ECMWF model manages to reproduce a realistic ozone field. However, there are some biases compared to independent observations and the very low ozone values observed in the Antarctic ozone hole are not reproduced well. The assimilation of ozone data leads to a good total column ozone field in the ECMWF analysis that agrees well with observations. Additional work is required to improve the vertical distribution of ozone in the analyses. This work includes developping a bias correction scheme for ozone data, and an improved formulation of background error covariances or control variable for ozone.
Preparations are under way to make use of new satellite data that give more information about ozone and water vapour in the stratosphere. The prime candidates for this are data from various instruments onboard ESA's ENVISAT. Retrievals from MIPAS and GOMOS give ozone and water vapour profile information in the stratosphere and mesosphere, and have a better vertical resolution than the ozone data currently used at ECMWF. These retrievals together with total column ozone from SCIAMACHY are currently monitored at ECMWF and their quality is being assessed. It is planned to assimilate these data in the near future, provided the data quality is good and the data products are stable.
Acknowledgements
A. Dethof would like to thank A. Simmons , E. Hólm and A. Untch for their helpful comments and contributions to this article.
References
Anderson, E. and Fisher, M., 2001, Developments in 4D-Var and Kalman Filtering, ECMWF Tech. Memo., 347.
Bithell, M. et al., 1994, On the synoptic interpretation of HALOE measurements using PV analyses. J. Atmos. Sci., 51, 2942-2956.
Cariolle, D. and Déqué, M., 1986, Southern hemisphere medium-scale waves and total ozone disturbances is a spectral general circulation model. J. Geophys. Res., 91, 10825-10846.Dethof, A. and Hólm, E., 2002, Ozone in ERA-40: 1991-1996. ECMWF Tech. Memo., 377.
Fortuin, J.P.F. and Langematz, U., 1995, An update of the global ozone climatology and on concurrent ozone an temperature trends. SPIE Proceedings Series, 2311, “Atmospheric Sensing and Modeling”, 207-216.
Hólm, E., et al., 2002, Assimilation and modelling of the hydrological cycle: ECMWF’s Status and Plan. ECMWF Tech. Memo., 383.
Hólm, E., et al., 1999, Multivariate ozone assimilation in 4D data assimilation. SODA Workshop on Chemical Data Assimilation Proceedings.
Jones, R.L., et al., 1986, The water vapour budget of the stratosphere studies using LIMS and SAMS satellite data. Quart. J. Roy. Meteor. Soc., 112, 1127-1143.
Randel, W. et al., 1998, Seasonal cycles and QBO variations in stratospheric CH4 and H2O observed in UARS HALOE data. J. Atmos. Sci., 55, 163-185.
Simmons A.J., and Gibson, J.K., 2000, The ERA-40 project plan. Era-40 Project Report Series 1.
Simmons A.J., et al., 1999, Stratospheric water vapour and tropical tropopause temperatures in ECMWF analyses and multi-year simulations. Quart. J. Roy. Meteor. Soc., 125, 353-386.
Untch, A., et al., 1999, Increased stratospheric resolution in the ECMWF forecasting system. SODA Workshop on Chemical Data Assimilation Proceedings.
![]()