Follow the guidelines stated in the Survival Guide
(SG).
The SG should be your next "best friend" (after the Lab. Manual)... :-)
Anyway, just in case, find bellow some more
hints:-)
As a general rule, try to write your report in such a way that someone
later on (that 'someone' might be you, after a couple of months,
while preparing for the lab. test) will be able to repeat the experiment
based only on the description you provide in the notebook!
You don't have to teach (too much of) the physics in your report;
just explain shortly what's all that about and what you're going to do
and why. Make sure someone can repeat your steps and understand the purpose
of the experiment.
What do I need to include in
the laboratory report?
The report must be written in pen (NOT
in pencil!)
Follow a logical development. Explain:
What you intend to do (a few phrases on this, at the beginning
of each new task)
Which is the method and the experimental setup to be used
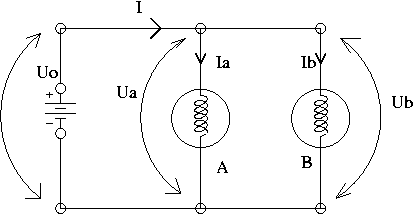
Provide a diagram of the setup, pointing
out (e.g. fig.5 from DC-1) clearly, right on the dia. which are the
quantities to be measured (e.g. the voltage drop across
a bulb, the current flowing through a wire, the length of the tube etc.).
Use letters & figures to outline the relevant nodes, sides
etc. of the setup.
Do not overwhelm the picture.
Present the data you took in a properly labeled table ( if
you feel that the table is the best way to organize them).
Don't forget to quote the units, everywhere they
have to be!
Calculations are to be made and shown on the 'rough work' side
in the notebook.
REMEMBER: you should always put the right units and the (reading)
errors for each measured or/and calculated value (even on the rough
work side - it helps a lot later!).
If a graph is required, you may draw a 'draft' one just to check
that you get the right pattern. Do it on the "rough work" side. Then,
using pencil (NOT pen) draw a 'nice' one on the graph paper provided.
Or use the fit program on Faraday.
An example of a hand-made graph is displayed in the room MP126 (near
the ice container). It refers to the experiment "Mechanical Equivalent of
Heat" - but the look of the graph and the way it is done are good guidelines
for the general case.
Provide a conclusion for the results that you got.
You may, at this point, write down the 'strange' things which
happened during the setup or data taking. Try to find an explanation for
them.
Don't "sweep the garbage under the carpet" by ONLY saying
that "the errors are in charge" for the deviation of your result from
the expected value, or for some other effects or mismatches.
If you wish to explain this kind of phenomena (and you are encouraged
to do so if you want an A !), then provide a numerical
estimate to demonstrate that the deviation can be made up by
what you think is the source.
Discussion on the method of and possible extensions to the
experiment probably looks better at the end of the report (but is not mandatory
to write them at the end; you may as well do that as you go, at each step
:-) ).
At the end of each completed task read again what you wrote.
Are you happy with the content and the way of presentation? Would it
be clear enough for someone else ?
Back to main page
Last revised: May 13, 2003.
© Sorin Codoban, 2003