Previous: Aerosol measurements by LIDAR Next: Conclusion Up: Ext. Abst.
III. Analysis and discussion
III.1. Analyses from daily ECMWF assimilation
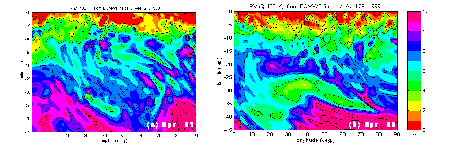
From examination of meteorological fields given on a daily basis by the ECMWF as derived for the 400 K potential temperature level (in the lower stratosphere), Potential Vorticity (PV) contours have been computed for the whole studied period (April 21 - June 30). FIGURE 2 shows the longitude´latitude cross-sections of the PV field obtained on April 21st and 29th.
One can note that, on the 29th, a large low-PV zone occurs and stands from 25° to 45°South and from 15° to 75° East : 2 £ PV £ 6 PVU. Its centre is situated around 30°S and between 28° and 44°E with the lowest PV values : PV £ 3 PVU. For comparison, the 21st PV map, which is representative of the studied period, indicates that expected PV values in the anomaly zone are about 8 PVU.
III.2. High resolution PV advection contours
In order to check about the origin of the increase, a high resolution advection model has been used for the period from 21 to 30 April. That model can produce a continuous evolution. The non-conservative terms of the large scale field are taken into account using a relaxation toward the ECMWF analysis. It has been used for real time 5 days forecasts of the PV fields and has been found useful for the sub-tropical and polar filaments detection and alert in the frame of the METRO project MEridional TRansport of Ozone in the lower stratosphere), a research project included in the European campaign THESEO (THird European Stratospheric Experiment on Ozone).

|
| FIGURE 2 : Potential Vorticity analyses derived from ECMWF fields, for the 400 K potential temperature level. By comparison with the 21st PV map (a), a large low-PV zone is well identified on the 29th (b). It stands from 25° to 45°south and from 15° to 75° east. |
|
(a)
|
(b)
|
|
|
|
| FIGURE 3 : PV contours as obtained with a high resolution PV advection model for April (a) 23rd, (b) 25th, (c) 28th and (d) 30th. | |
Those PV contours are in favour of a tropical/extra-tropical mass exchange through filament events in a motion similar to the one produced by planetary-scale breaking waves in the stratosphere (Leovy et al., 1985 ; McIntyre and Palmer, 1983). In fact, it is the large-scale Rossby waves in the Westerlies that pull the tracer from tropics into mid-latitudes in the form of large-scale filaments through the surf zone (McIntyre and Palmer, 1984).
From analysis of the ECMWF zonal wind component (not shown) we have noted that the wind direction had changed in the upper stratosphere during the studied period: the zonal wind was getting westerly, what permitted to the Rossby planetary modes to propagate upward into the stratosphere. Besides, the LIDAR temperature profiles recorded over Durban reveal much variability from day to day (not shown). what highlights disturbances due to the planetary waves that propagate through the westerlies upward into the stratosphere in middle and high latitudes.
Moreover, when we examine the water vapour distributions in the troposphere, as revealed by satellite Infrared images (not shown), we note the presence of a convection event localised over Brazil on the 23rd.
In connection with the PV contours shown above (FIGURE 3), the observed convection event could be associated to a tropospheric source of aerosols, which may have been :
Examination of water vapour distributions in the troposphere (not shown) obtained on the 29th, shows that the tropospheric jet stream, which could have also induced a tropospheric-stratospheric exchange, was localised nearly in the middle of the Atlantic ocean, far from the south-western coast of Africa. What supports the suggestion that the observed aerosol loading event, that happened in the upper troposphere and lower stratosphere over Durban site, results meanly from a tropics/extra-tropics meridional air mass transfert.
Previous: Aerosol measurements by LIDAR Next: Conclusion Up: Ext. Abst.