Previous: Introduction Next: Analysis and discussion Up: Ext. Abst.
II. Aerosol measurements by LIDAR
The present study has been undertaken thanks to LIDAR observations at Durban (30°S, 30°E), South Africa. That system has been implemented on the campus of the university of Natal in the frame of a bi-lateral French-South African co-operative research programme.
From the return signal back-scattered by successive atmospheric layers in the local troposphere and stratosphere, aerosol and temperature profiles can be derived, assuming that observed layers behave like a perfect gas in hydrostatic equilibrium (Hauchecorne and Chanin, 1980 ; Chazette et al., 1995). For that purpose our aerosol retrieval method is based on Klett inversion (Klett, 1981) that gives a convergent solution LIDAR equation and permit to obtain the Mie scatter ratio (total to molecular atmospheric back-scatter ratio) :
![]()
Molecular parameters are computed on the basis of ECMWF daily
fields.
The operating LIDAR at Durban is a Rayleigh-Mie system. The emitted beam is green, at 532 nm wavelength, and it is generated by a Nd:YAG pulsed laser with a repetition rate of 10 pulses per second. The receiver is made of two telescopes and two PhotoMultiplier detectors. LIDAR observations are thus made through two separate, but identical, channels. One channel is allocated to probe the troposphere. It uses the return signal collected by the smallest telescope, which total receiving surface is about 0.03 m?. The other channel has a total receiving surface of about 0.36 m?, and its observation field is directed to receive back-scatter photons from stratospheric layers. More information about instrumental details and temperature profile retrieval method and validation are given by Bencherif et al. (2000).
|
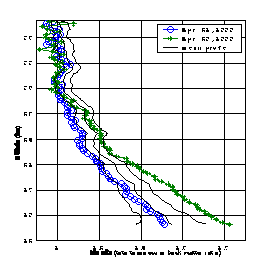
The LIDAR data set used in this study is made of daily records of back-scattered photons obtained over Durban during the period from April 21 to June 30, 1999. FIGURE 1 shows the derived Mie scatter ratio profile averaged over the studied period (over 28 profiles) and the corresponding standard deviations : Raverage(z) ± s In the lower stratosphere, the maximum value is obtained at the height of »18 km for Rmax »1.36. Above the 29 km height, all Mie scatter ratio values are in the neighbourhood of unity : at this altitude range, the atmosphere can be considered as typically molecular. On the same figure, we have superimposed Mie scatter ratio profiles recorded on April 21st and 29th. By comparison, it comes that the 21st profile is similar to the averaged one, while the 29th profile indicates that, for altitudes lower than 22 km, the aerosol back-scatter has significantly increased : R29(z=18 km) »1.56 (see FIGURE 1). |
FIGURE 1: : Mie scatter ratio profile averaged for period from April 21 to June 30 (over 28 profiles), obtained by LIDAR over Durban, superimposed to profiles recorded on April 21st and 29th (see legend) |
A similar aerosol profile is obtained the day after on April 30 (not shown), indicating the same pattern : an aerosol increase in the upper troposphere and the lower stratosphere.
Those LIDAR profiles suggest that by the end of April aerosol scatter has significantly and abnormally increased in the upper troposphere and the lower stratosphere as compared to the whole period results. That aerosol loading can be related to :
Previous: Introduction Next: Analysis and discussion Up: Ext. Abst.