Previous: Model Experiment Next: Conclusion Up: Ext. Abst.
In order to investigate the relevence of the structure found in the model experiment to the real atmosphere, UKMO Assimilated Data is used to advection experiments on isentropic surfaces in the wintertime upper stratosphere. The data contain fields of temperature, geopotential height, and wind components on the levels from 1000hPa to 0.316 hPa on a 3.75° x 2.5° grid.
Horizontal wind data are interpolated on isentropic surfaces and linearly interpolated in time. The data on isentropic surfaces are expanded to spherical harmonic function and wind velocity on arbitral point is calculated by reverse transformation of the spectrum.
The wintertime upper stratosphere in the southern hemisphere is examined, where the 4-day wave caused by barotropic instability of the polar-night jet is dominant and turbulent mixing due to breakings of the planetary waves propagating upward from the troposphere is considerably weak.
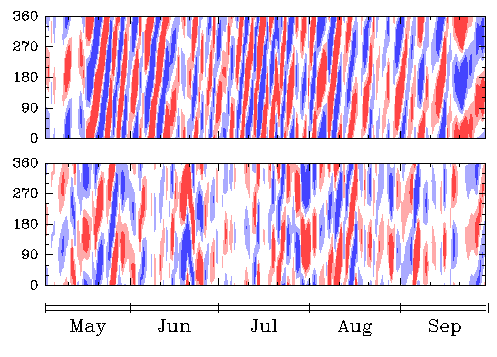
Figure 4 is time-longitude sections at 1800K and 72°S of wave 1 in PV, showing moving component by substracting 20-day running mean. Generally, eastward-propagating wave with period of 3-4 days, called the 4-day wave is dominant in wintertime upper stratosphere. It is dominated by zonal wavenumbers from 1 to 4, traveling eastward with the same phase speed.
Large wave amplitude propagating eastward with period of 3-4 days is seen in 1999 (top), especially in mid-winter. Calculations below are all started at Jul 7. We compared results in 1999 with those in 1992 (bottom), in which the amplitude is weakest of all the past available data.

Fig.4 Time-longitude sections at 1800K and 72S of wave 1 in PV, showing moving component by substracting 20-day running mean, in 1999 (top) and 1992 (bottom).
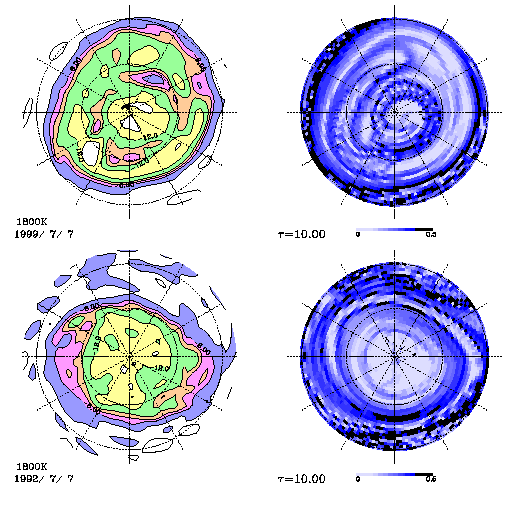
Finite-time Lyapunov Exponents are calculated with the evaluation time of Ä=10 days as shown in Fig.5, with the snap shot of PV at 1800K on Jul. 7. The edge of the polar vortex is on 45-55°S. Distribution of high exponents outside the polar vortex show the evidence of strong mixing. Very low exponents at the edge of the vortex suggest that transport barrier is formed there. Inside the vortex, we can see the differences between the two results. Relatively high region is on 60-70°S in 1999 (top), while almost whole region inside the vortex is covered with low exponents in 1992 (bottom). The high region in 1999 corresponds the region of strong signal of the 4-day wave.

Fig.5 Snap shot of PV on 1800K on Jul 7 in 1999/1992 (left). Finite-time Lyapunov Exponents calculated from Jul.7 with the evaluation time of 10 days (right).
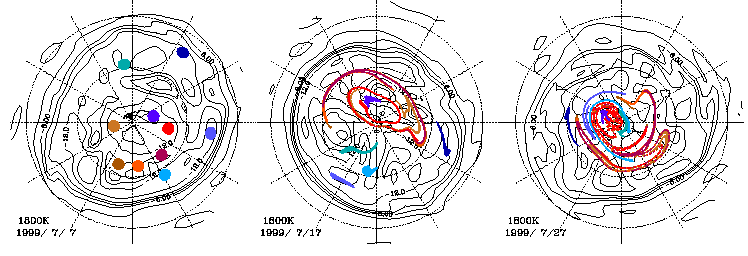
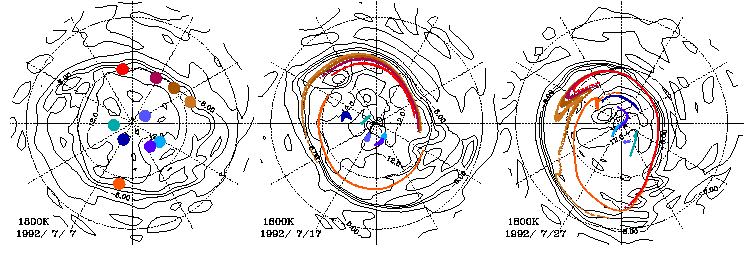
Dispersion of lots of particles placed in an limited area is computed on the isentropic surface. We select five points at which the finite-time Lyapunov exponent for Ä=10 is highest and lowest, respectively, inside the vortex. Initially we put 1000 particles randomly in the circle centered on the points with a radius of 0.05 rad, and calculated the advections of the particles. Figure 6 shows the results in 1999 (top) and in 1992 (bottom). Warm colors denote the points of high exponents, and cold colors denote low. At first, particles are stretched out to a thin line element and, after that, the element is distorted and folded. Stretching and folding processes are repeated and particles are mixed with surrounding as seen in the model experiment. However, well-mixed region is limited to a finite area near the 70° and the particles in the other region keep their identities even after 20-day advection. In 1992, on the other hand, air inside the polar vortex rotate around the pole like a rigid body. Only particles near the edge of the vortex is stretched by the meridional shear of the jet, but not mixed after 20-day advection.


Fig.6 Advections on 1800K of 1000 particles from five points at which the finite-time Lyapunov exponent is highest and lowest, respectively. Calculations start Jul. 7 1999 (top) and in 1992 (bottom).