 |
S P A R C
Stratospheric Processes And their Role in Climate
|
|||||||
| Home | Initiatives | Organisation | Publications | Meetings | Useful Links |
Processes governing the chemical K. Law, Service d’Aéronomie du CNRS/IPSL, France (kathy.law@aero.jussieu.fr) This article also appears in the IGAC newsletter. Introduction and Background The links between atmospheric chemistry and climate are receiving increasing attention on several fronts. One region where the two are tightly coupled is the Upper Troposphere/Lower Stratosphere (UTLS), which spans the altitude range from ~8-16 km (depending on latitude). Transport in this region and, in particular, exchange between the troposphere and stratosphere occurs through a combination of processes including, in the tropics, cumulus convection, and in the extratropics, synoptic-scale weather systems, together with the large-scale Brewer-Dobson circulation. It is recognized that net exchange from troposphere to stratosphere in the tropics and from stratosphere to troposphere in the extratropics is under large-scale dynamical control (Holton et al. 1995). However, the net exchange alone does not determine many important aspects of chemical distributions in the UTLS region. Recent observational and modelling studies have further revealed important complexities in UTLS dynamical processes and chemistry, the interplay between the two, and consequences for chemical distributions in the UTLS. In particular these studies have raised questions about the best definition of the boundary between the troposphere and stratosphere, i.e. the tropopause. This applies both to the tropics and to the extratropics. The processes and scientific questions in the two regions are rather different and confining attention to one or the other has some advantages. The subject of this report is the extratropical UTLS, i.e. poleward of the subtropical jets. Many important aspects of the tropical UTLS are discussed in recent papers by Folkins (2005), Folkins and Martin (2005), Gettelman et al. (2004) and Küpper et al. (2004) and references therein. Based on this new information, a more sophisticated picture is being put together of the factors controlling UTLS chemistry and climate feedbacks. Perturbations to the distributions of trace gases such as O3, H2O, and aerosols in this region can lead to direct forcing of climate. Indirect effects through, for example, changing cirrus following new particle production or contrail formation from aircraft emissions can also impact the radiative balance in this region. In turn, climate change, through changing temperatures and transport patterns, has the potential to effect the chemical composition of the extratropical UTLS and thus the composition of the troposphere and stratosphere. Transport of ozone from the stratosphere to the troposphere may change in response to ozone recovery and greenhouse gas impacts in the stratosphere. Also, as noted in the WMO 2003 Ozone Assessment, transport in the extratropics from the troposphere to the stratosphere of very short-lived halogenated species (VSLS; in particular bromine-containing compounds) and pollutants may be important for understanding current and future stratospheric ozone change. In an effort to integrate and synthesize new findings and their implications, the IGAC Project (International Global Atmospheric Chemistry; under IGBP and CACGP) and the SPARC Project (Stratospheric Processes and their Role in Climate; under WCRP) held a joint workshop at the Max Plank Institut für Chemie, Mainz in May 2005 to discuss processes governing the chemical composition of the Upper Troposphere and Lower Stratosphere (UTLS) in the extratropics. One aim of the workshop was to update our current state of knowledge following previous workshops discussing the tropopause (i.e. in Bad Tölz, Germany, 2001; Haynes and Shepherd, 2001) and chemistry- climate interactions (Giens, France, 2003; Ravishankara et al. 2004) which both included some discussion about extratropical UTLS composition. It was also felt that it is timely to review these issues given the upcoming WMO assessment in 2006 and given the issues raised in the previous ozone assessment (WMO, 2003). It was also noted that it is nearly 10 years since the publication of the very influential review by Holton et al. (1995), which summarized the state of knowledge at that time related primarily to dynamical drivers of stratosphere-troposphere exchange (STE). Recent observations and modelling studies allow for refinement of these concepts, especially with respect to small(er)-scale dynamics and coupling to chemical composition. Workshop Design & Discussion Topics The workshop discussions were designed around four major scientific questions (outlined below) pertinent to improving our understanding about UTLS extratropical chemical composition. Invited overview presentations were given on sub-themes identified within each topic and these were followed by lively discussions in plenary. Discussions were also held in breakout sessions where it was decided to combine the first two topics and discuss the roles of dynamical and chemical processes together. Rapporteurs summarized the discussions on the last day of the meeting. This report summarizes these discussions, focusing on the main highlights from the workshop. The four framing questions for the workshop were: 1) Which dynamical and meteorological processes govern the chemical composition, especially ozone and water vapour, of the extratropical UTLS on seasonal and interannual timescales? On a large scale, both temporally and spatially, the chemical composition of the extratropical UTLS is influenced by the downward transport of trace gases via the large-scale stratospheric circulation and the upward transport of trace constituents from the troposphere by dynamical processes such as frontal uplift and deep convection. Coupling of air masses between the subtropical UT and the extratropical LS may also be important. Many important details of these transport processes still need to be understood. Analyses of various data sets are now providing insights into the causes of large-scale seasonal and possibly interannual variability in transport processes and chemical composition. The extent to which small-scale processes (e.g. gravity wave breaking near the tropopause, turbulence in the vicinity of jet-streams, radiative processes associated with upper level clouds and condensation) play a role in governing the composition and exchange within the extratropical UTLS is also not well known. In addition, there is increasing evidence that deep convection or convection embedded in frontal systems could be important. 2) What is the relative importance of chemical versus dynamical processes in governing the chemical composition of the extratropical UTLS? Analysis of observational data sets has shown that an extratropical tropopause layer (ExTL) exists in chemical composition between the stratosphere and troposphere which exhibits characteristics of both regions. The extent to which dynamical and/or chemical processes are influencing the composition of this region still remains to be quantified. A better characterization of how strongly the 3-D spatial (latitudinal, longitudinal, altitudinal) and seasonal chemical fields in this region are perturbed by exchange processes between the stratosphere and troposphere is needed in order to identify the relative importance of the chemical and dynamical processes. The impact of different processes such as (pyro-) convection and small-scale mixing on chemical composition are very uncertain and require better quantification. 3) Which chemical/physical processes are important in governing UTLS composition? The physical conditions of the UTLS region (low T, decreasing pressure) give rise to particular conditions such that chemical reactions proceed at different rates than in the lower troposphere or the main bulk of the stratosphere. Large uncertainties still surround our knowledge about many reaction rates and pathways (e.g. VOC degradation, VSLS degradation) which could be important for the chemical composition of this region and which influence the distributions and budgets of HOx, NOx, BrOx and O3, for example. Very little is known about the aerosol budget in this region. In addition, heterogeneous reactions on ice/aerosols are also very uncertain, as are the processes governing aerosol formation/ ageing, ice super-saturation and cirrus properties. Scaling up from the process scale to realistic parameterizations in global models is also an issue. 4) How do we better quantify the net exchange of ozone and other trace constituents
between the stratosphere and the troposphere? The flux of ozone from the stratosphere is an important term in the tropospheric ozone budget but global model estimates of net flux still vary by more than a factor of two (EU Chemistry-Climate report, 2004). In addition to the climate impacts, intrusions of ozone-rich stratospheric air into the troposphere can occasionally have significant implications for local regulation of allowable ground-level ozone concentrations and the achievability
of established limits. Given that the flux may already have changed or may change in a future climate, it is important to quantify this flux more accurately using new, better metrics. Variations in the methods
used to determine the flux together with the paucity of independent estimates based on observations is contributing to these uncertainties. In particular, there is a need to define more meaningful parameters Discussion Summaries Summaries of the plenary talks and breakout
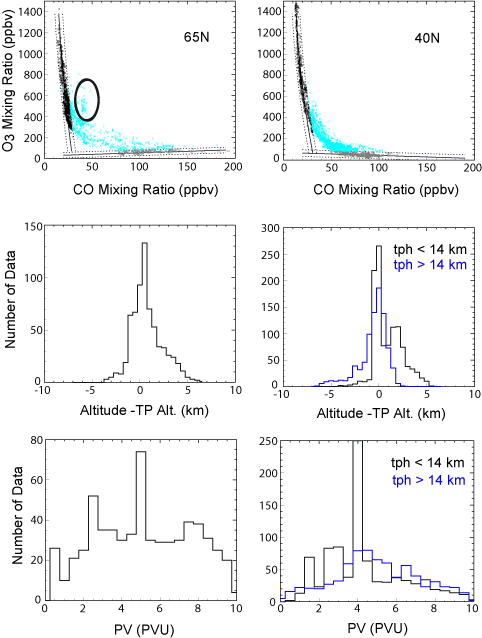
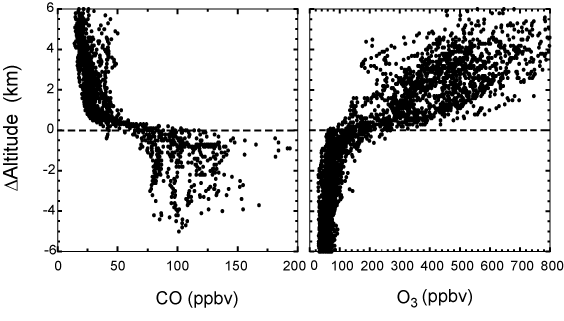
sessions follow. Reference is made in some cases to talks given by specific speakers, Chemistry and Dynamics: Indicators and Controlling Factors of UTLS Chemistry The Extratropical Tropopause Layer (ExTL) While the boundary between the troposphere and stratosphere is generally considered to be defined by the thermal tropopause, this definition is not necessarily appropriate or meaningful when discussing chemical composition. The chemical and thermal tropopause are not generally coincident and further, the chemical transition from UT to LS is not as abrupt or well-defined as the temperature transition. The workshop discussions followed the progress made in the last five years to identify and characterize the ExTL from various in situ and satellite observations of chemical tracers. Trace gas profiles of O3, CO, CO2, N2O and H2O, as well as scatter plots among these species, obtained from recent observations made as part of the airborne MOZAIC, CARIBIC, SPURT, STRAT/POLARIS and AIRS satellite projects, clearly reflect the existence of a transition layer in the upper troposphere/ lowermost stratosphere (UT/LMS) where the chemical composition gradually changes from tropospheric (e.g. high CO, low O3) to stratospheric (low CO, high O3). Figure 1 shows an example of a CO-O3 correlation in the tropopause region where mixing lines (light blue) in the ExTL connect a tropospheric (gray) and a stratospheric (black) trace gas reservoir. Number density distributions relative to the thermal tropopause show that the lower bound of the ExTL extends into the UT. The exact position is hard to determine, since it is neither associated with the thermal tropopause nor with a fixed value of potential vorticity (PV). The upper bound of the ExTL (or the depth of the layer) depends to some extent on the residence time of the tracer under investigation. It is generally higher for species that have a long photochemical lifetime in the LMS (e.g. H2O) than it is for short-lived species like CO, whose tropospheric signature is erased on a time-scale of a few months due to net oxidation by OH in the LMS.
As outlined in a talk by K.
Rosenlof, the chemical composition
of the LMS is a function
of the relative strength of several
processes, such as episodic
diabatic upwelling, in particular
in NH summer, quasi-isentropic
cross-tropopause transport,
and diabatic downwelling from
the overworld in the Brewer
Dobson circulation. The first process is associated
with deep overshooting convection
and pyro-convection, and its bulk impact is
largely unknown. In contrast, the upwelling
is relatively easy to quantify via the calculation
of EP fluxes1, however there is still Analysis of seasonal variations of trace gas
measurements, presented by P. Hoor for
the SPURT project, reveals the importance
Meteorological processes Several key meteorological processes in the troposphere contribute to the aforementioned episodic diabatic upwelling into the LMS. These processes include synoptic- scale transport events referred to as conveyor belts as well as smaller-scale deep convective systems. Both conveyor belts and deep convective events are associated with significant latent heat release due to condensation of water vapour and therefore they are distinct from isentropic transport. The role of these non-isentropic transport events for stratosphere-troposphere exchange (STE) has gained increased attention during the last years and hence constituted the main items of the presentations by A. Stohl and M. Lawrence. The discussion of meteorological processes
that are associated with significant transport
events from the stratosphere to the
troposphere (STT) or vice versa (TST)
started on the synoptic scale. In his presentation
on this topic, A. Stohl focused on
the Lagrangian perspective and first suggested M. Lawrence presented a concise
overview on the role of deep
convection for STE. He showed
that observations, parameterizations
and cloud resolving models
(CRMs) have been used to
study this process. Almost no
direct observations exist for STT
due to convection, but idealized Analysis of observations (e.g.
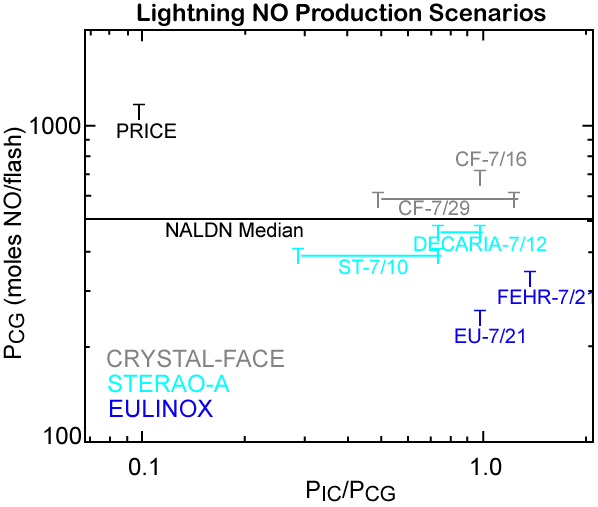
STERAO, EULINOX, TRACE-P)
has shown that transport of pollutants by
this mechanism is important at extratropical
latitudes, especially over Asia and central
North America, leading to perturbations
in upper tropospheric trace constituent
Recent evidence indicates that convection
associated with forest fires, so-called pyroconvection,
may also have a significant
impact on mid-latitude UTLS composition.
New modelling work presented by G.
Luderer using the ATHAM model showed
that the initiation of a deep pyro-convection
event is very dependent on background
meteorological conditions (e.g.
cold frontal passage) as well as the sensible
and latent heat budgets of the storm, the
fire and the environment. There is a wealth of new evidence from airborne instruments
(e.g. recent ICARTT campaign over
North Atlantic in 2004; MOZAIC data
over Siberia in 2003; MOPITT CO satellite
data – 2003/2004) of significant enhancements
to the levels of trace gases such as
CO during summertime periods of boreal
forest burning. Whilst mainly confined
to the free troposphere, certain very large
pyro-convective storms can also penetrate
above the tropopause, injecting material
into the LMS. M. Fromm showed examples
of enhanced values of aerosol (as viewed
in terms of aerosol index by the POAM II
satellite) several kilometers above the local
tropopause in the LS. Enhanced CO and
acetonitrile concentrations have also been
observed in the LS and are attributed to forest
fire emissions (e.g. Crystal-FACE, Jost et
al. 2004; Livesey et al. 2004; MOZAIC, J.-P.
Cammas; Ray et al. 2004). The significance
of these events – which may be occurring In addition to the new information emerging
from field campaigns and satellites there have
also been significant developments in the
complexity of processes included in Cloud
Resolving Models (CRMs) and mesoscale
models, such as the inclusion of detailed
chemical schemes including soluble species
as well as aerosol and microphysical processes.
However, many discrepancies still exist
between different models, as shown by recent
comparisons (M. Barth). In particular, further
validation is required of trace gas transport
by convective systems into the LS and for Mixing processes During the workshop discussions it was evident
that there is a need to clarify the terminology
around small-scale mixing phenomena.“Mixing” is sometimes used to mean“molecular mixing” and sometimes used to
mean “stirring”, i.e. deformation of material
surfaces (and hence concentration fields of
chemical species) by differential advection
so that molecular diffusion is potentially
enhanced, but without that diffusion necessarily Two different types of stirring may be
important to molecular-level mixing. The first is stirring via the large-scale flow,
which can be resolved by global climate
models and in global meteorological data
sets. Here the distinction between stirring
and mixing is important because the
time-scale for molecular mixing may be
significantly larger than the time-scale for
stirring, as estimated by stretching rates.
The second is stirring by three-dimensional
turbulence arising in convective clouds,
through breaking of gravity waves, and
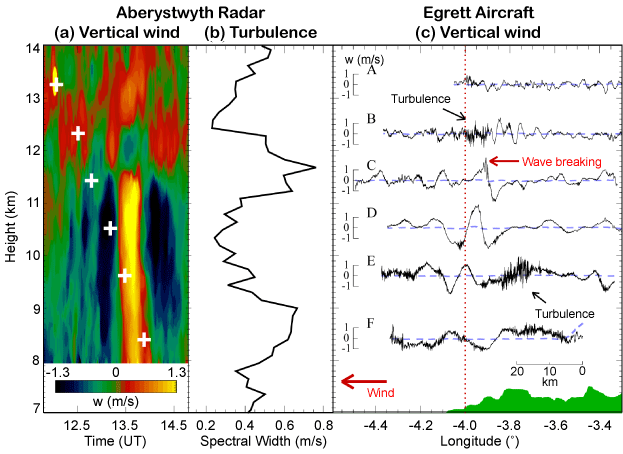
other such processes. The nature of threedimensional J. Whiteway, G. Vaughan and others noted
that inertia-gravity waves are likely to play a
significant role in mixing in the tropopause
region and above since their breaking gives
rise to intermittent layers of three-dimensional
turbulence (Figure 6; see colour
plate I). These waves may be generated by
topography, by convection, or by synopticscale
processes. However, the importance
of convection for gravity-wave generation
One way of assessing the quantitative
aspects of mixing is direct observations
of the mixing processes themselves (J.
Whiteway). Another is to try to infer the
characteristics of mixing from the observed
structure of chemical concentrations fields,
and determining which model representation We know that global models with horizontal
resolution of 100 km or greater and satellite
observations with resolutions of tens
of kilometers cannot represent observed
chemical concentration variations on scales
of 1 km or less. However, a more important
question is whether the neglect of these
variations leads to systematic large-scale
errors in chemical predictions. This has
been investigated in three different ways: (i)
the implications of changing model resolution
have been explored (Esler et al. 2004);
(ii) the chemical implications of smoothing
in situ observations to give spatial
resolutions typical of global models have
been investigated (Crowther et al. 2002,
Esler et al. 2004); (iii) the effect of mixing At present there are, as noted above, clearly
several limitations to the representation of
mixing in models. With Lagrangian models
the difficulty is how to represent mixing
effects without losing the essential simplicity
of the Lagrangian approach. With
Eulerian models the difficulty is how to In situ Chemical and Microphysical Processes The large- and small-scale dynamical processes discussed in the previous section alter the extratropical UTLS chemical composition by moving and mixing air masses between the troposphere and stratosphere. In situ chemical and microphysical processes in this thermodynamically and chemically unique region further alter its composition. Here we discuss several key species of particular importance to chemistry/climate interactions, controlling processes, and what steps are needed to better constrain them. Discussions below are based on presentations given by K. Carslaw, J. Crowley, M. Dorf, A. Gettelman, D. Murphy, T. Peter, A. Ravishankara, H. Singh, B. Thornton, and R. von Glasow. Photochemistry Upper tropospheric HOx and NOx: An accurate
knowledge of the abundances of HOx
and NOx in the upper troposphere is critical,
since photochemical production of
O3 is controlled by the reactions of NO
with HO2 and RO2. Recent observations
in the field and laboratory have yielded
insights to some important controlling
processes. Observations from many tropospheric
aircraft flights indicate that models
tend to overestimate HOx. These data were
generally obtained at lower altitudes and
at a higher ambient humidity than earlier
observations that exhibited a discrepancy
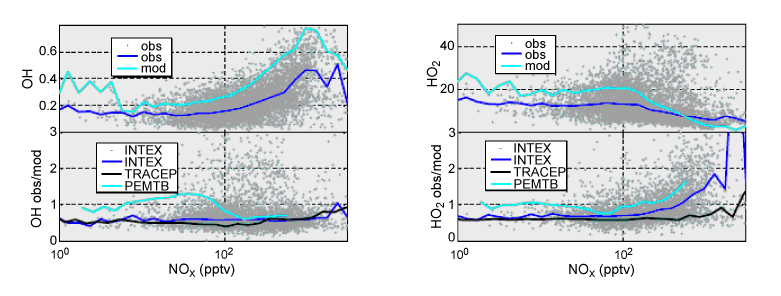
in the opposite direction. Observations
also indicate that models tend to underestimate
the HO2/OH ratio at high levels
of NO by large amounts (Figure 7).
Recent laboratory observations show that,
at high NO concentrations, the production
of a few percent yield of HNO3 by the
NO+HO2 reaction may alter the HO2/OH
ratio to be more consistent with observations
(Butkovskaya et al. 2005). Finally,
laboratory data have shown that acetone
photolysis may be a less efficient source of
HOx than was previously believed (Blitz et
al. 2004). Future approaches for constraining
controlling processes on UT HOx and
NOx include: i) efforts to validate measurements of HOx precursors via simultaneous
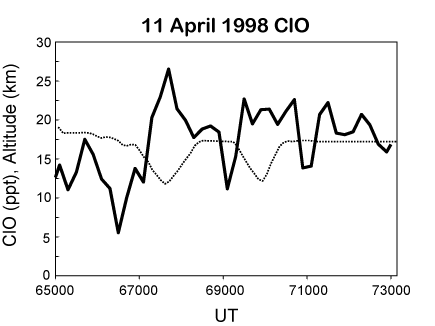
Chlorine Activation: Recent aircraft data
show that levels of ClO between 30 and
40 pptv are quite commonly observed at
high latitudes in the northern hemisphere
for stratospheric air masses within several
kilometres of the tropopause (Thornton
et al. 2003). Levels of ClO between 20 and
30 pptv are also observed in the extratropical,
UTLS region (Figure 8). These
observations suggest that Cl activation on
sub-visible cirrus, or on cold sulphate aerosols,
might be responsible for a significant
component of observed depletion of lower
stratospheric ozone (Solomon et al. 1997;
Bregman et al. 2002), in contrast to earlier
studies in dry, particle-poor regions of the
extratropical UTLS (Smith et al. 2001).
The global significance of these regions of
activated ClO is unclear. The observations
of high ClO tend to occur in a spatially
non-homogeneous manner. This could
be due to variations in available chlorine
along the flight track, which is difficult to
assess without accurate, precise, high-temporal
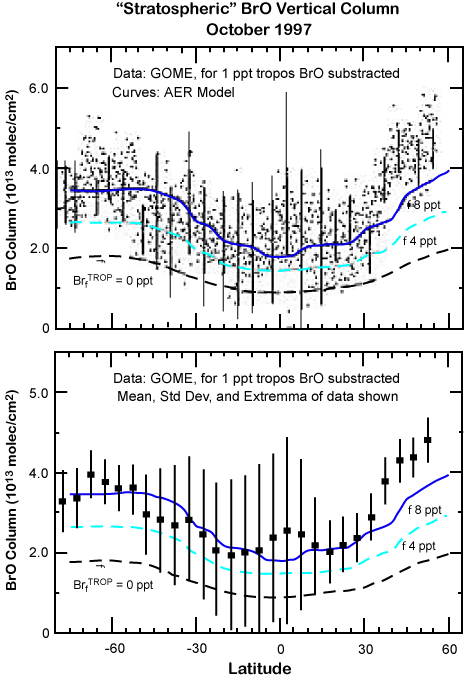
Bromine and Iodine: Measurements of total
column BrO by the GOME instrument
reveal abundances that are more than a
factor of two higher than found in typical
models (Figure 9). The first issue raised by
these observations is the need to define the
relative contribution of tropospheric BrO
and stratospheric BrO to this discrepancy.
Results to date are not consistent. Groundbased
measurements of the variation with
solar zenith angle of differential slant column
BrO suggest most of the discrepancy
is caused by a global, ubiquitous, 2 to 3
pptv level of background BrO in the free
troposphere (e.g. Müller et al. 2002). On
the other hand, ground-based measurements
of diffuse and direct solar radiation
indicate an upper limit for tropospheric
BrO of 0.9 pptv at 45°S, with mean values
of ~0.2 pptv (Schofield et al. 2004). This
suggests the discrepancy between measured
and modelled column BrO might
be the result of significantly higher levels
of bromine in the LS than are commonly
found in models. If BrO really is ~2-3pptv
throughout the troposphere as suggested
by the former study, then the BrO+HO2
cycle could represent an important sink for
O3 (von Glasow et al. 2004), the hydrolysis
of BrONO2 could be an efficient route for
production of HNO3 (Lary, 2004), and BrO
could be a significant oxidant for DMS
(and perhaps other species) in the marine
boundary layer (Boucher et al. 2003). If the“excess” bromine is in fact in the LS, this
bromine could be supplied by the decomposition
products of very short lived (VSL)
bromocarbons and could have important
consequences for our understanding of
ozone trends (WMO, 2003). The substantial
organic content of many aerosol particles
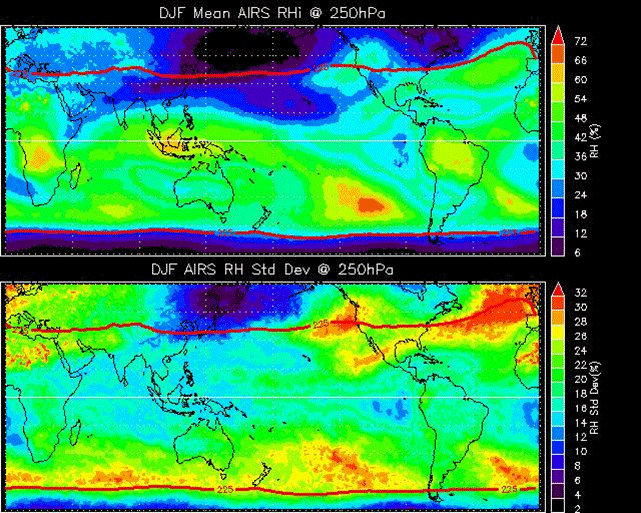
Humidity and Microphysics Water abundance and supersaturation: An
accurate knowledge of the abundance of
H2O and ambient temperature is crucial
for understanding cirrus cloud formation,
estimating radiative forcing, and accurately
retrieving aerosols and trace chemical species from satellites. Ice super-saturation
has been frequently detected in clear air
and inside cirrus clouds, predominantly
in the UT (Jensen et al. 2001; Haag et al.
2003). Satellite observations point to a
high variability of relative humidity in
the ExTL in regions of major storm tracks
(Figure 10; see colour plate II). These are
regions of significant dynamical perturbations,
likely coinciding with enhanced
mixing of tropospheric H2O across the
tropopause. This picture is corroborated
by a few case studies of cross-tropopause
tracer transport. Mixing ratios of H2O
well above stratospheric background levels
are observed, reaching far into the LMS,
especially in summer (C. Schiller, breakout
discussions). Supersaturation and the
nucleation of the ice phase appears to be
confined to a vertically narrow layer (up
to 1 km thick at mid-latitudes and more
extended polewards) above the tropopause
(Pan et al. 2000). In situ processes affecting
H2O amount and cloud formation/frequency
near the ExTL do not seem to influence
Aerosol transport and composition: Aerosol
precursor gases and primary aerosol particles
are injected into the UTLS by rapid
vertical transport processes such as WCBs
and deep convection (including pyro-convection),
thereby influencing the aerosol
budget and high cloud occurrence around
the ExTL (K. Carslaw). Besides organics,
many UT particles contain both sulfate
and carbon and a large fraction contain
insoluble inclusions such as mineral dust
and soot (Murphy et al. 1998; Kojima et
al. 2004). A small number of such particles
may act as efficient heterogeneous
ice nuclei, affecting cirrus formation by
freezing at lower supersaturations than
for liquid particles. The influence of aerosols Ice formation from aerosols: Ice cloud formation
and characteristics may be changing
due to two influences: a change in the
abundance and properties of ice-nucleating
aerosols (i.e. the aerosol indirect effect),
and changes in the small-scale dynamical
forcing patterns (Kärcher and Ström,
2003). The relative importance of these
two is not well known. The dependence of
the number of ice crystals on the updraft
speed in a rising air parcel is much stronger
than in liquid clouds, making cloud formation
processes more susceptible to small
dynamical changes than in the mid- to
lower-troposphere. Frequent observations
of high ice supersaturation in conjunction
with high ice crystal number densities suggest
a global-scale predominance of homogeneous
freezing in the UTLS (DeMott
et al. 2003; Gayet et al. 2004; Hoyle et al.
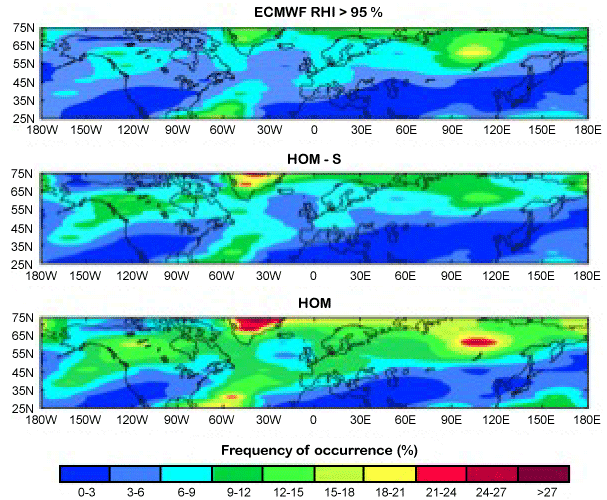
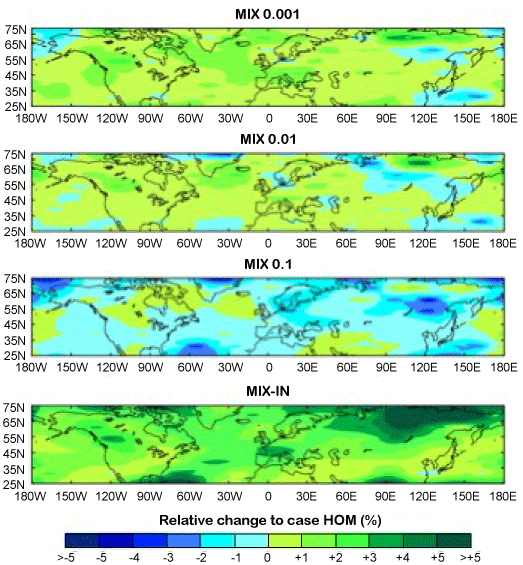
2005). Homogeneous freezing is sensitive
to changes in the variability of vertical
air motion on spatial and temporal scales
unresolved by global models (Figure 11; see
Gas uptake in cirrus clouds: Uptake of chemically
active trace gases by cirrus ice crystals
could possibly lead to vertical redistribution
or even irreversible removal of the gas
from UT air masses, potentially altering the
ozone budget there (J. Crowley). Molecules
residing at the surfaces of ice crystals might
alter ice particle growth rates by modifying
the super-saturation over individual crystal
facets (Gao et al. 2004). Cubic ice may alter
ice crystal nucleation and growth, possibly
over a wider range of temperatures than
previously thought (Murray et al. 2005).
A number of field measurements indicate
there is substantial uptake of HNO3 in low
temperature cirrus clouds, in one case even
in concert with enhanced in-cloud supersaturation.
According to recent laboratory
measurements, equilibrium uptake models
frequently used in the past to calculate the Quantifying Net Exchange of Trace Constituents Quantifying the global stratosphere-troposphere exchange (STE) of atmospheric species is a prerequisite for identifying the roles of different dynamical and photochemical processes in controlling this flux. In particular, the net flux of ozone (from stratosphere to troposphere) and of water, as well as aerosols (from troposphere to stratosphere) are critical elements in the stratosphere-troposphere coupling and thus in the overall chemistry-climate coupling. As has been discussed, the area of transition from the troposphere to stratosphere is a region of partial mixing, small-scale dynamical processes, and unusual chemistry the stratosphere and the troposphere. Key questions now being asked include: (1) How important is O3 STE to the tropospheric
O3 budget and the overall
tropospheric oxidative capacity (i.e.
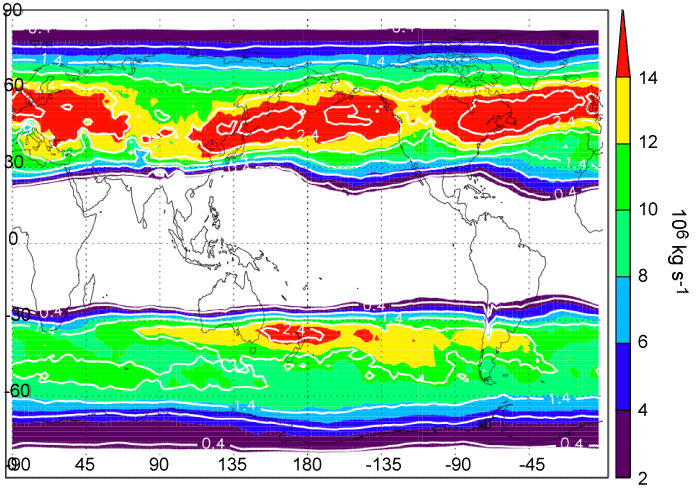
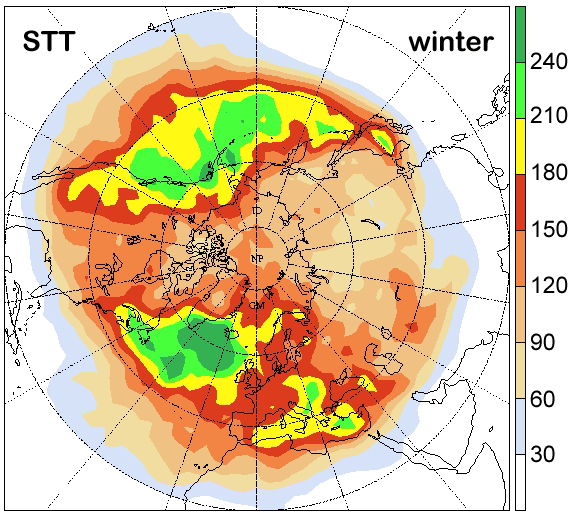
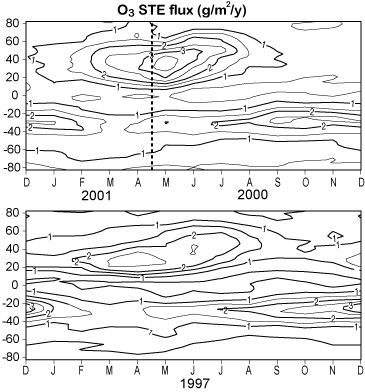
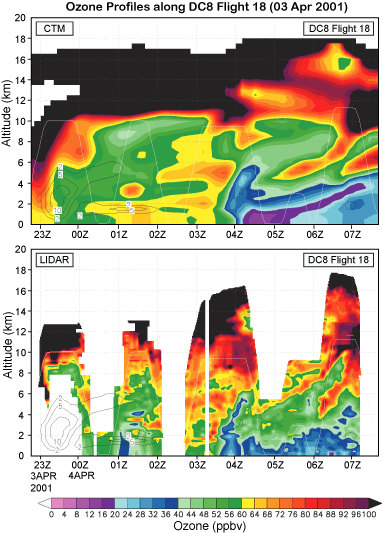
OH)? Answers to the above questions form the knowledge base required for estimating the chemical feedback in a changing climate. Over the last decade, significant progress has been made in quantifying STE flux on both global and regional scales, and over both annual and synoptic times. Studies have ranged from high-resolution process studies to global integrations. In terms of the global pattern and magnitude of STE there is increasing convergence from the knowledge base of a decade ago, but complete agreement has not yet been reached. An example is given in Figure 13 (see colour plate III), where mass flux calculations using two different models (one Eulerian and one Lagrangian) show similarity in the preferred location of the net diabatic flux (Figure 13a; Olsen et al. 2004) and the downward flux (STT, Figure 13b; Sprenger and Wernli 2003). These two quantities are comparable since STT is the dominant component of the net flux in the extratropics. The knowledge base is such that it is possible to generate maps of the O3 STE on regional and monthly scales and to produce the now classic latitude by-month plot of zonal mean O3 STE to match the similar O3 vertical column plots, as shown in Figure 14 (Hsu et al. 2005). With increasing model resolution and the use of analyzed meteorological fields, global CTMs are beginning to be able to reproduce the spatial and temporal variability observed in trace gas distributions, and they have become a useful tool for case studies of STE events. Examples from several field campaigns and intensive modelling studies have shown that in some cases we can model the fine, filamentary structure of ozone folds at the tropopause. Nonetheless, this remains a difficult task, as shown in Figure 15 (see colour plate III) (Wild et al. 2003), due to the fact that current CTMs still lack the full resolution of the observed structures. (M. Prather, M. Olsen, L. Pan, A. Gettelman, A. Stohl, K. Law).
Ten years ago, an important observational
constraint to the calculated stratospheric
ozone flux was given by the relationship
of ozone with N2O (Murphy and Fahey,
1994). Tracer correlations in the LMS have
proven useful in deriving global, annual
mean fluxes of many constituents between
the stratosphere and troposphere and in
understanding the age of stratospheric air
(i.e. time since it last was in the troposphere).
Despite recent progress, the community
has yet to digest and incorporate this new knowledge into current applications. For
example, the STE terms in the tropospheric
ozone budgets among major models still
differ by a factor of 2 to 3. This raises
the important question: How can our
A confounding factor in determining STE in models is that observations of chemical discontinuities show that transport barriers appear to exist across the tropopause (Figure 16) and the choice of the precise transport boundary may make a significant difference in the calculated flux. Models, on the other hand, often produce much smoother chemical transitions, in part due to numerical diffusion within the models. A key question is whether the calculated flux depends on the choice of boundary, which would imply that chemical transformations in the transition zone are important. (L. Pan, M. Prather, A. Gettelman)
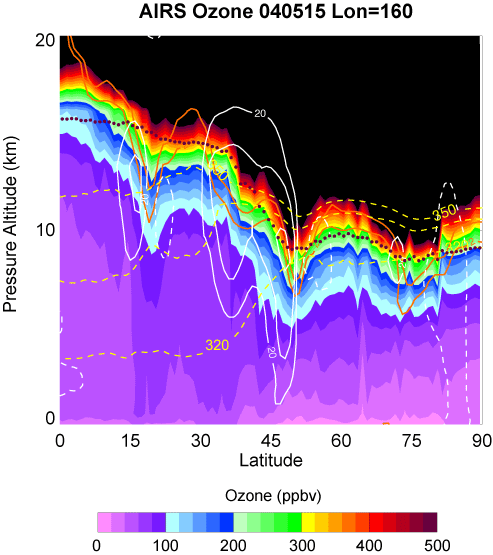
Further, defining a correct location for the“boundary” between the stratosphere and troposphere can be ambiguous because of the presence of ExTL, which has a mix of stratospheric and tropospheric chemical characteristics. Should we determine a new way of defining STE flux with consideration of this transitional layer? Would accurate simulation of the ExTL change the STE flux? This is only important if there are chemical sources/sinks in this layer, because in the absence of chemical processes, the ozone flux is conserved across the ExTL. (K. Law, M. Prather) Over the past 25 years, there have been significant long-term declines in midlatitude LS ozone levels, and this is an important factor in changing the STT flux of ozone. Both dynamics and chemistry likely contribute to this long-term ozone depletion. The possible importance of VSLS to enhancing the chemical loss of O3 due to Cly and Bry species was discussed. More observations are needed to quantify the significance of VSLS-related long-term ozone depletion, as well as the relative contribution of chemical and dynamical forcings to the observed longterm changes in ozone. (J. Logan, R.Salawitch) New satellite data
provide an exciting
opportunity
for validating
and constraining
models in the
UTLS region. In
particular, the
AIRS instrument
Concluding Remarks While perhaps more questions than answers
emerge from the above discussions, the
convergence of knowledge at the workshop
was very useful in helping better define
what is known regarding processes controlling
the composition of the extratropical
UTLS. Just as important, the workshop It is clear that consistent use of welldefined
terminology (c.f. STE=STT+TST)
is imperative, so that disparate studies
can be integrated for a larger-scale picture.
In this regard there is especially a
need to better understand the newlyidentified
ExTL. Given the complex thermodynamic In some cases, focused measurement campaigns
would allow us to clarify which processes
are significant to the extratropical
UTLS region and therefore warrant more
extensive study. For example, targeted measurements
of aerosol composition in the
northern hemisphere UTLS, in conjunction
with satellite data analysis, could help determine
how pyro-convection is influencing the
chemical and optical properties of particles Laboratory studies of reaction rates and
heterogeneous ice cloud formation processes
under conditions appropriate for
the mid-latitude UTLS region are needed
for more accurate model representation.
Focused studies are also needed to understand
how the coupling of dynamical Finally, there is a need to incorporate existing knowledge into models in order to assess regional and global-scale impacts on, for example, cirrus cloud formation. In particular, while some key species and processes are starting to be included in CTMs and CRMs there is still the need to determine appropriate parameterizations for GCMs and CCMs. While models’ predictions of STE across the extratropical tropopause have recently improved, large uncertainties in flux calculations still exist. New metrics must be found for validating these models against observations. Acknowledgements: We would like to thank IGAC, SPARC and the European ACCENT projects for their financial support of the workshop, and Claudia Keller, Bettina Krueger, Gudrun Schlaf, Christian Gurk and Markus Jonas for their very helpful on-site support in Mainz. Acronyms: References Blitz, M. A., et al. Pressure and temperaturedependent
quantum yields for the photodissociation
of acetone between 279 and 327.5 nm, Boucher, O., et al. DMS atmospheric concentrations
and sulphate aerosol indirect radiative
forcing: a sensitivity study to the DMS source Bregman B., et al. Chemical ozone loss in the
tropopause region on subvisible ice clouds, calculated
with a chemistry-transport model, J. Butkovskaya, N. I., et al. Formation of nitric acid
in the gas-phase HO2+NO reaction: effects of
temperature and water vapor, J. Phys. Chem. A, Crowther R., et al. Characterising the effect of
large-scale model resolution upon calculated
OH production using MOZAIC data, Geophys. Cziczo, D.J., et al. Observations of organic species
and atmospheric ice formation, Geophys. Res.
Lett., 31, L12116, oi:10.1029/2004GL019822, DeCaria, A. J., et al. Lightning-generated NOx
and its impact on tropospheric ozone production:
A three-dimensional modeling study of DeMott, P.J., et al. Measurements of the concentration
and composition of nuclei for cirrus
formation, Proceed. Natl. Acad. Sci., 100 (25), Eckhardt S., et al. A 15-year climatology of warm conveyor belts, J. Climate, 17, 218-237, 2004 Esler, J. G., et al. Stratosphere-troposphere exchange: Chemical sensitivity to mixing, J. Geophys. Res., 106(D5), 4717-4732, 10.1029/2000JD900405, 2001. Esler, J. G., et al. A quantitative analysis of gridrelated
systematic errors in oxidising capacity
and ozone production rates in chemistry transport European Commission report on Ozone-Climate Interactions, Air pollution research report No 81, EUR 20623, 143pp, 2003. Folkins, I., Temperatures, Transport, and Chemistry in the TTL, SPARC Newsletter 25, 23-26, 2005. Folkins, I. and R. V. Martin, The vertical structure
of tropical convection and its impact on the
budgets of water vapor and ozone, J. Atmos. Sci., Fromm, M., et al. Observations of boreal forest
fire smoke in the stratosphere by POAM III,
SAGE II, and lidar in 1998, Gephys. Res. Let., 27, Fromm, M., et al. Pyro-cumulonimbus injection
of smoke to the stratosphere: observations and
impact of a super blowup in northwestern Canada Gao, R.S., et al. Evidence that ambient nitric acid increases relative humidity in low-temperature cirrus clouds, Science, 303, 516-520, 2004. Gayet, J.-F., et al. Cirrus cloud microphysical
and optical properties at southern and northern
midlatitudes during the INCA experiment, Gettelman, A., et al. Radiation balance of the
tropical tropopause layer, J. Geophys. Res., 109
(D7), D07103, doi:10.1029/2003JD004190, Haag, W., et al. Freezing thresholds and cirrus
cloud formation mechanisms inferred from in
situ measurements of relative humidity, Atmos. Haag, W., and B. Kärcher, The impact of aerosols and gravity waves on cirrus clouds at midlatitudes. J. Geophys. Res., 109, D12202, doi:10.1029/ 2004JD004579, 2004. Haynes P. and T. Shepherd, Report on the
SPARC Tropopause Workshop, Bad Tölz, Germany,
17-21 April 2001, SPARC Newsletter, 17, Holton, J.R., et al. Stratosphere-troposphere exchange, Rev. Geophys., 33, 403-439, 1995. Hoor, P., et al. Seasonality and extend of extratropical
TST derived from in-situ CO measurements
during SPURT, Atmos. Chem. and Phys., Hoor, P., et al. Tropical and extratropical tropospheric
air in the lowermost stratosphere over
Europe : A CO-based budget, Geophys. Res. Lett., Hoyle, C.R., et al. The origin of high ice crystal number densities in cirrus clouds, J. Atmos. Sci., 62, 2568-2579, 2005. Hsu, J., et al. Diagnosing the stratosphere-totroposphere
flux of ozone in a chemistry transport
model, J. Geophys. Res., 110, 2005JD006045, Jensen, E.J., et al. Prevalence of ice-supersaturated regions in the upper troposphere: Implications for optically thin ice cloud formation, J. Geophys. Res., 106 (D15), 17253-17266, 2001. Jeker, D. P., et al. Measurements of nitrogen oxides
at the tropopause: attribution to convection
and correlation with lightning, J. Geophys. Res., Jost, H-J., et al. In-situ observations of midlatitude
forest fire plumes deep in the stratosphere,
Geophys. Res. Lett., L11101, doi:10.1029/ Kärcher, B. and J. Ström, The roles of dynamical variability and aerosols in cirrus cloud formation, Atmos. Chem. Phys., 3 (3), 823-838, 2003. Kärcher, B. and M.M. Basko, Trapping of trace gases in growing ice crystals, J. Geophys. Res., 109, D22204, doi:10.1029/2004JD005254, 2004. Kojima, T, et al. Aerosol particles from tropical
convective systems: Cloud tops and cirrus anvils,
J. Geophys. Res., 109, D12201, doi:10.1029/ Küpper, C., et al. Mass and water transport
into the tropical stratosphere: A cloud-resolving
simulation, J. Geophys. Res., 109, D10111, Lary, D. J., Halogens and the chemistry of the free troposphere, Atmos. Chem. Phys. Discuss., 4, 5367-5380, 2004. Livesey, N., et al. Enhancements in lower stratospheric CH3CN observed by UARS MLS following boreal forest fires, J. Geophys. Res., 109, D06308, doi:10.1029/2003JD004055, 2004. Marcy et al. Quantifying stratospheric ozone in the upper troposphere with in situ measurements of HCl, Science, 304, 261-265, 2004. Müller, R.W. et al. Consistent interpretation of ground based and GOME BrO slant column data, Adv. Space Res., 29, 1655-1660, 2002. Murphy, D. M., and D. W. Fahey, An estimate of
the flux of stratospheric reactive nitrogen and
ozone into the troposphere, J. Geophys. Res., 99, Murphy, D.M., et al. In situ mesurements of organics,
meteoritic material, mercury, and other
elements in aerosols at 5 to 19 kilometers, Science, Murphy, D. M. and D. S. Thomson, Halogen
ions and NO+ in the mass spectra of aerosols in
the upper troposphere and lower stratosphere, Murray, B.J., et al. The formation of cubic ice under conditions relevant to Earth’s atmosphere, Nature, 434, 202-205, 2005. Olsen, M. A., et al. Stratosphere-troposphere exchange of mass and ozone, J. Geophys. Res., 109, D24114, 2004, doi:10.1029/2004JD00186. Olson, J. R., et al. Testing fast photochemical theory during TRACE-P based on measurements of OH, HO2, and CH2O, J. Geophys. Res., 109, D15S10, doi:10.1029/2003JD004278, 2004. Pan, L. L., et al. The seasonal cycle of water vapor and saturation vapor mixing ratio in the extratropical lowermost stratosphere, J. Geophys. Res., 105, 26519-26530, 2000. Pan, L. L., et al. Definitions and sharpness of the
extratropical tropopause: A trace gas perspective,
J. Geophys. Res., 109, D23103, doi:10.1029/ Petzoldt, K., et al. Four years of NOy measurements in the UTLS by MOZAIC aircraft, EGU Poster 2nd General Assembly, Wien, 24– 29 April 2005; Abstract: EGU05-A-08034. Price, C., J. Penner, and M. Prather, NOx from lightning: 1. Global distribution based on lightning physics, J. Geophys. Res., 102, 5929-5941, 1997. Ravishankara, A.R., et al. Chemistry Climate Interactions : A report from the joint SPARC/IGAC workshop, IGACtivities Newseltter, 30, 2004. Ray, E. A., et al.Evidence of the effect of summertime midlatitude convection on the subtropical lower stratosphere from CRYSTAL-FACE tracer measurements. J. Geophys. Res., 109, D18304, doi:10.1029/2004JD004655, 2004. Rosenlof, K. H., et al. Hemispheric differences in
water vapor and inferences about the transport
in the lower stratosphere, J. Geophys. Res., 102, Salawitch, R. J. et al. Sensitivity of ozone to bromine in the lower stratosphere, Geophys. Res. Lett., 32, 10.1029/2004GL021504, 2005. Schofield, R. et al. Retrieved tropospheric
and stratospheric BrO columns over Lauder,
New Zealand, J. Geophys. Res., 109, D14304, Smith, J. B., et al. Mechanisms for midlatitude
ozone loss: Heterogeneous chemistry in the
lowermost stratosphere?, J. Geophys. Res., 106, Solomon S., et al. Heterogeneous chlorine chemistry in the tropopause region, J. Geophys. Res., 102, 21411-21429, 1997. Sprenger, M., and H. Wernli, A northern
hemispheric climatology of cross-tropopause
exchange for the ERA15 time period (1979– Stohl, A., et al. A New Perspective of Stratosphere– Troposphere Exchange, Bull. Amer. Met. Soc., 84, 1565-1573, 2003. Stohl A. and T. Trickl, A text-book example of
long-range transport: Simultaneous observation
of ozone maxima of stratospheric and Thornton B.F. et al. In situ observations of ClO near the winter polar tropopause, J. Geophys. Res., 108, Art. No. 8333, 2003. Ullerstam, M., et al. Uptake of gas-phase nitric
acid to ice at low partial pressures: evidence for
unsaturated surface coverage, Faraday Discuss., von Glasow R., et al. Impact of reactive bromine chemistry in the troposphere, Atmos. Chem. Phys., 4, 2481–2497, 2004. Whiteway J. A., et al. Airborne measurements of gravity wave breaking at the tropopause, Geophys. Res. Lett., 30, 2070, doi:10.1029/2003GL018207, 2003. Wild, O., et al.CTM ozone simulations for spring 2001 over the western Pacific: Comparisons with TRACE-P lidar, ozonesondes, and TOMS columns, J. Geophys. Res., 108(D21), 8826, doi:10.1029/2002JD003283, 2003. WMO, ‘Scientific Assessment of Ozone Depletion:
2002’, World Meteorological Organization
Global Ozone Research and Monitoring Project |
