|
Stratospheric Processes And their Role in Climate
|
||||||||
| Home | Initiatives | Organisation | Publications | Meetings | Acronyms and Abbreviations | Useful Links |
![]()
|
Stratospheric Processes And their Role in Climate
|
||||||||
| Home | Initiatives | Organisation | Publications | Meetings | Acronyms and Abbreviations | Useful Links |
![]()
SHADOZ (Southern Hemisphere Additional Ozonesondes): A New Source of Ozone and Temperature Data from a Tropical Network
A. M. Thompson, NASA/GSFC, Greenbelt, USA (anne.m.thompson@nasa.gov)
J. C. Witte, SSAI at NASA/SFC, Greenbelt, USA
S. J. Oltmans, NOAA/CMDL, Boulder, USA
F. J. Schmidlin for the SHADOZ Investigator Team, NASA/Goddard/Wallops Flight Facility, Wallops Island, USABackground and Project
Total ozone column amount, a sign of the health of stratospheric ozone, is tracked by satellite in concert with a ground-based network of upward-looking Dobson or Brewer spectrophotometers. For analysis of stratospheric and tropospheric processes and trends, profiles from balloon-borne ozonesondes are also required. The network of stations used for the 1998 Assessment sponsored by SPARC and the International Ozone Commission (WMO, 1998; Randel et al., 1999) and the on-going series of WMO/UNEP Ozone Assessments (WMO, 1999) consists of approximately 100 sites at middle and high latitudes of the northern hemisphere (http://www.msc-smc.ec.gc.ca/woudc/). Ozonesonde measurements have been made regularly since the late 1970's at Natal, Brazil (Kirchhoff et al., 1981) but at most other tropical locations, measurements have been associated with campaigns or with local efforts unsupported for data distribution.
In 1998 NASA's Goddard Space Flight Center (GSFC), together with NOAA’s Climate Monitoring and Diagnostics Laboratory (CMDL) and international sponsors established the SHADOZ (Southern Hemisphere ADditional OZonesondes) project to address the gap in tropical ozonesonde coverage (Thompson et al., 2002a,b). SHADOZ augments launches at selected sites and provides a public archive of ozonesonde and radiosonde data from eleven tropical and subtropical southern hemisphere operational ground stations (see Table 1). The first SHADOZ site in the tropical northern latitudes (Paramaribo, Surinam) joined in 2000. Data are available to the community at the website maintained at NASA/Goddar (http://croc.gsfc.nasa.gov/shadoz/)
Current sampling at all stations is once-per-week or twice a month, usually but not always, mid-week. Balloon-borne ozonesondes are coupled with a meteorological radiosonde for data telemetry transmitting air pressure and temperature, relative humidity, and ozone to a ground receiving station. All stations are using electrochemical concentration cell (ECC) ozonesondes. Radiosonde packages vary from station to station and determine the recording frequency and raw data format. A uniform format is used in the SHADOZ archive, however.
Table 1. SHADOZ tropical and subtropical ozonesonde stations. Only data from 1998 onward is in the SHADOZ archive. Ascension Is. 8S, 14W F. J. Schmidlin NASA/WFF 1990-92; 1997-pres. American Samoa 14S, 171W S. J. Oltmans NOAA/CMDL 1995-present San Cristóbal, Ecuador 1S, 90W S. J. Oltmans NOAA/CMDL 1999-present Fiji Is. 18S, 178E S. J. Oltmans NOAA/CMDL 1996-present Watukosek, Java 8S, 113E T. Ogawa NASDA, Japan 1993-present Nairobi, Kenya 1S, 37E B. Hoegger, B. Calpini Météo Suisse 1996-present Malindi, Kenya 3S, 40E G. Laneve Univ. Rome, Italy 1999-present Natal, Brazil 5S, 35W V. W. J. H. Kirchhoff INPE, Brazil 1978-present La Réunion, France 21S, 55E F. Posny Univ. de La Réunion 1992-present Irene, S. Africa 26S, 28E G. J. R. Coetzee SAWS 1990-93; 1998-pres Tahiti Is 18S, 149W S. J. Oltmans NOAA/CMDL 1995-1999 Paramaribo, Surinam H. Kelder KNMI, The Netherlands 1999-present
Table 2. Campaign Data Aerosols 99 Cruise US to So. Africa Thompson et al (2000) January-February 1999 SOWER Christmas Is. (2N, 157W) Hasebe et al (2000) March 1999 INDOEX Kaashidhoo Male Is, (5N, 74E) Zachariasse et al (2001) February-March 1999 SAFARI-2000 Lusaka, Zambia (15S, 28E) Thompson et al (2002c) September 2000
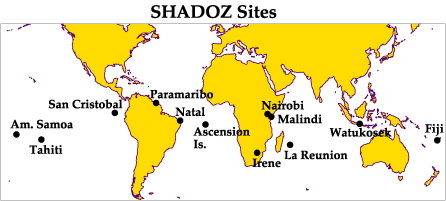
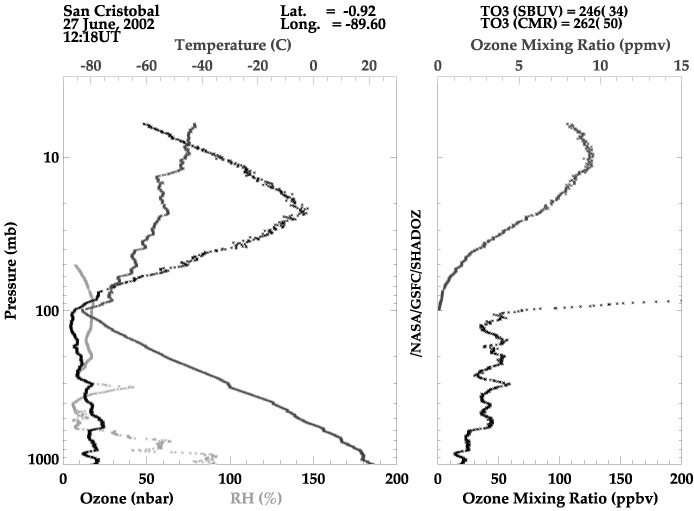
Currently SHADOZ data from 1998-2002 are publicly available (> 1600 ozone and PTU profiles); data from four tropical campaigns also reside at the SHADOZ website. Figure 1 displays the SHADOZ stations and Figure 2 shows a typical profile image displayed at the website for every launch.
Figure 1. Map of SHADOZ stations. There are 11 stations currently operating; Tahiti ceased launches at the end of 1999.
Figure 2. An example of a typical sonde profile image at the SHADOZ website: San Cristóbal in the Galapagos, 27 June 2002.
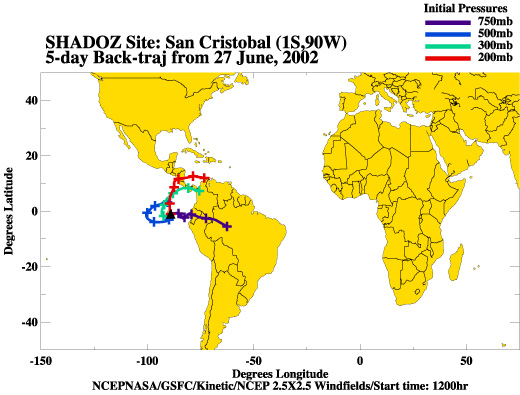
In addition to the data archive, the SHADOZ website displays kinematic back-trajectories corresponding to the location and time of each station launch. Using 3-D wind fields and NCEP analyses, five-day back-trajectories are run at tropospheric pressure levels (750, 500, 300 and 200 hPa). Figure 3 shows a typical trajectory image.
Figure 3. An example from the SHADOZ website of 5-day backtrajectories at fixed pressure levels as shown in key. Every 24 hours is marked by a cross. The illustration corresponds to the launch with profiles shown in Figure 2.
Ozone Profile Climatologies from SHADOZ Data
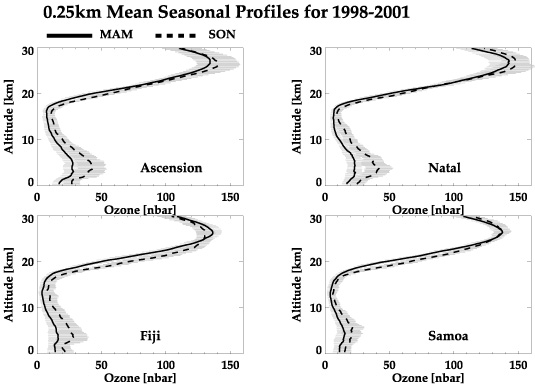
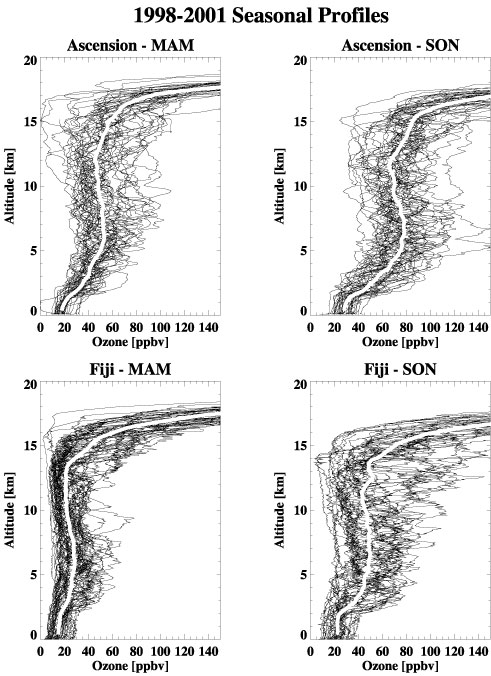
Figure 4 shows seasonal mean ozone profiles for 4 sites. September-October-November (SON) ozone values are greater than for March-April-May (MAM) throughout the entire profile. The shading, representing the 1-sigma range of variability, shows greatest breadth in the middle stratosphere (where the sonde instrument becomes “noisy”) and in the troposphere. Seasonal mean differences (between MAM and SON) for stratospheric column ozone range from 11-20 DU, depending on site (Thompson et al., 2002a). Less than 5 DU of this difference is due to the tropopause being lower in SON than in MAM.
Figure 4. Seasonal profiles using 1998-2001 data for four SHADOZ stations: Ascension; Natal, Fiji, Samoa. Solid line represents March-April-May (MAM) 0.25 mean profiles. Dashed lines represents September- October-November (SON) means. Grey shading is the 1-sigma deviation around the mean.
In the troposphere, week-to-week ozone variations are due to sources with greatly disparate ozone content (e.g. clean marine air vs pollution from biomass fires). This variability is most pronounced at Atlantic stations (e.g. Ascension, Figure 5), Nairobi and Réunion (not shown) in SON. Figure 5 also depicts variations at Fiji that are due to sporadic transport from biomass burning regions of Africa, Southeast Asia and Australia. From Figure 5, it appears that averaged profiles, typically used for analysis of trends, may not be statistically robust. Temporal changes in tropospheric ozone might more accurately be evaluated by categorising profiles according to synoptic regime [Diab et al., 2002; Hudson et al., 2002] and analysing each category.
Figure 5. Multiple profiles from 1998-2001 at Ascension and Fiji for March-April-May (MAM) and September-October-November (SON) with the solid white line the mean over the four years.
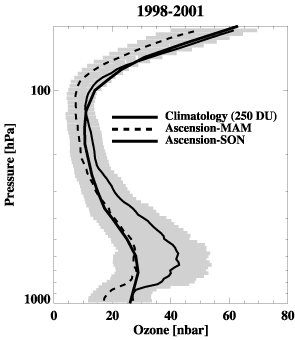
The variability in tropospheric ozone observed in SHADOZ profiles has implications for satellite ozone retrievals. For example, a typical satellite profile, that used by the EP-TOMS (Earth Probe - Total Ozone Mapping Spectrometer) instrument for a total 250 DU ozone column, appears in Figure 6. Seasonally averaged profiles from Ascension Island are also depicted. Note that ozone in SON at Ascension differs markedly from the standard profile. Although the impact on the total ozone column retrieval is relatively small (Thompson et al., 2002b), retrieval in the lower troposphere may be compromised by the discrepancy with the recent observations. SHADOZ offers a more realistic dataset for satellite algorithms.
Figure 6. Comparison of the TOMS profile climatology (250 DU total ozone) with 1998-2001 km mean profiles for MAM (March-April-May) and SON (September-October-November) for Ascension. Grey shading indicates the 1-sigma deviation about the seasonal means. Other station comparisons appear in Thompson et al. (2002b).
The Tropical Zonal Wave-one
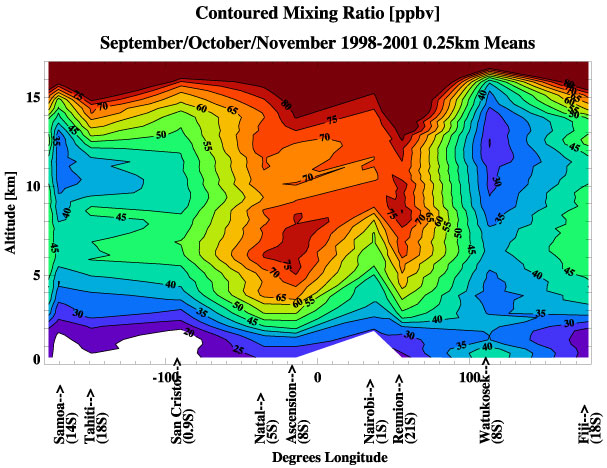
The zonal wave-one refers to relatively high total column ozone over the tropical Atlantic region compared to the column amount over the Pacific and Indian Ocean regions. The wave-one is seen in satellite data and was first described by Shiotani (1992) and further characterised by Hudson and Thompson (1998). Due to instrument imprecision in the lower stratosphere, satellite data are not adequate to determine whether the wave-one is due to a tendency for the excess ozone in the stratosphere, the troposphere or both. With the comprehensive spatial and temporal coverage of tropica l ozone profile provided by SHADOZ, the structure of the wave-one can be studied for the first time.
Figure 7 shows that the wave-one is predominantly in the troposphere (see Thompson et al., 2002b for more details) with an “excess ozone” accumulation in the Atlantic upper troposphere for SON. This is the season of the greatest magnitude of the wave-one, ~20 DU more column ozone over the Atlantic maximum than over the Pacific. It is well-known that transport and recirculation of ozone from African and South American biomass burning is a factor in the higher-ozone features in the middle troposphere ove r the Atlantic, adjacent continents, and western Indian Ocean (Fishman et al., 1990; Thompson et al., 1996). At all times of year upper tropospheric “excess ozone” over the Atlantic maintains a wave-one feature (Thompson et al., 2002a,b).
Figure 7. Contoured ozone mixing ratios in ppbv averaged for September through November (SON) 1998-2001. Details in Thompson et al. (2002b). Station locations by longitude with their respective latitudes and sonde sample numbers are marked below.
Convection in the Tropical Tropopause Layer
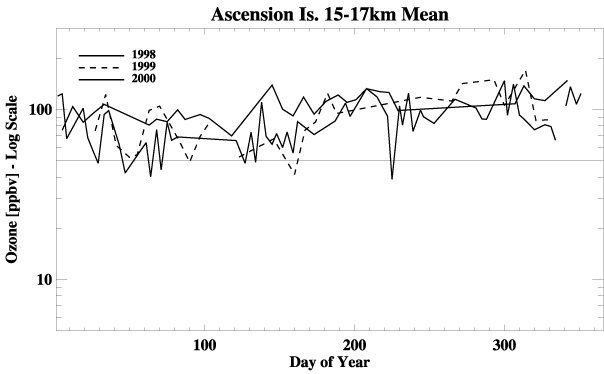
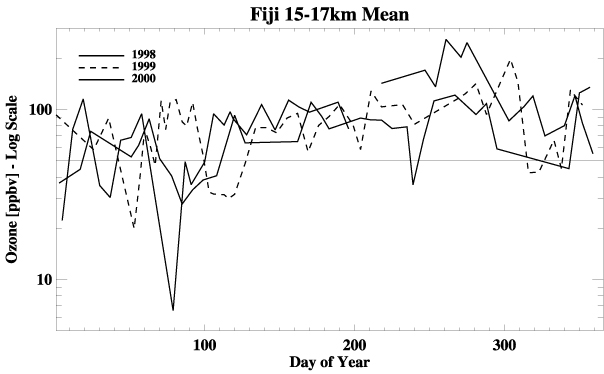
The tropopause is normally between 16-18 km except for the two most southerly SHADOZ sites (Réunion, Irene). Ozone variability in the 14-17 km region has been discussed by Folkins et al. (2000, 2002) where the tropopause has been found to be better described as a transition zone several km thick, the so-called TTL (tropical tropopause layer) rather than as a single-level sharp feature. In the TTL convective influence is highly variable. At Ascension Island, the week-to-week variability (Figure 8a) is relatively small (subsidence over the Atlantic dominates over convection) whereas at Fiji (Figure 8b) convection frequently brings low ozone air from the marine boundary layer into the upper troposphere.
Figure 8a - 8b. Ozone mixing ratio averaged within the tropopause region (15-17 km) for (A) Ascension Island; (B) Fiji. Note log scale and variations from year to year.
Quasi-Biennial Oscillation
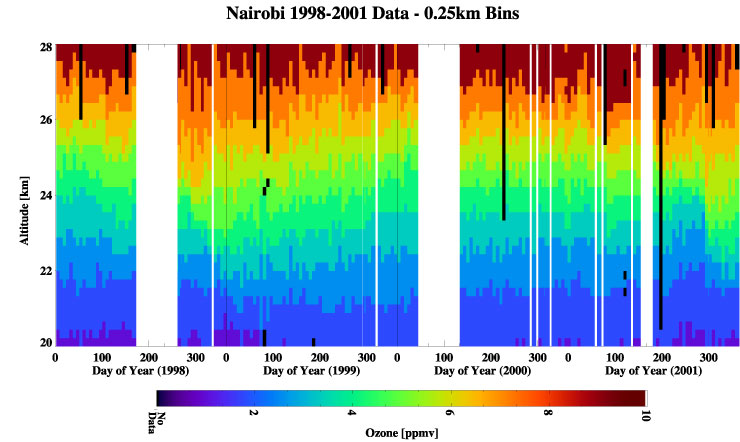
Thanks to dense temporal coverage of stratospheric ozone profiles near the equator, variations due to the QBO (Quasi-biennial Oscillation) have been identified in SHADOZ data. At most stations the SHADOZ record is approaching five years, approximately two full cycles of the QBO. Near the ozone mixing ratio maximum, variations due to shifts in easterly and westerly winds are most evident. An example through the 1998-2001 ozone record at Nairobi appears in Figure 9. A paper by Logan et al. (2002) discusses the QBO, SHADOZ and concurrent satellite data in detail.
Figure 9. Time-vs-altitude stratospheric ozone mixing ratio (in ppmv) based on 0.25 km averages for Nairobi during 1998-2001. Shifts in ozone mixing ratio between 24 and 28 km level correlate well with the QBO cycle. See Logan et al. (2002) for details.
Interaction with WMO
Although ECC sondes are used at all SHADOZ, small station-to-station differences in technique have been detected in the total ozone column (Thompson et al., 2002a). WMO’s JOSIE (Jülich Ozonesonde Intercomparison Experiment) activity has been working with the sonde community to understand these differences through a series of chamber tests (1996, 1998, 2000) and an upcoming field evaluation exercise (BESOS, June 2003). One goal for WMO is a standard procedure for ozonesonde operations for implementation at new GAW (Global Atmospheric Watch) stations. SHADOZ Investigators participated in JOSIE-2000 through comparison of sonde instruments with a calibrated spectroscopic instrument in chamber tests conducted at the Forschungszentrum – Jülich (http://www.fz-juelich.de/cgi-bin/icg2toicgii.cgi)
Summary
Over 1600 ozone and PTU profiles archived between 1998 and 2002 are now at the SHADOZ website: http://croc.gsfc.nasa.gov/shadoz/. With unprecedented coverage of southern tropical ozone data from SHADOZ the following scientific advances have been possible: improvement of the profile climatology for satellite algorithms; elucidation of the structure of the zonal wave-one in tropospheric ozone; delineation of vertical characteristics of the ozone response to the QBO.
Acknowledgments: SHADOZ is a partnership that would not be possible without the following sponsors: NASDA (National Space Development Agency of Japan), LAPAN (Lembaga Pener Rangan Bangan Dan Antariksa Nasional, the National Institute of Aeronautics and Space Agency of Indonesia), INPE (Instituto Nacional de Pesquisas Espaciais of Brazil), the South African Weather Bureau, the Swiss Meteorological Agency, the Kenyan Meteorological Department, the University of the South Pacific (Suva, Fiji), the University of Réunion Island (France), the Royal Dutch Meteorological Institute. For overall coordination and support, Goddard Space Flight Center, Wallops Flight Facility, NOAA’s Climate Diagnostics and Monitoring Laboratory, NASA’s ACMAP and TOMS Programs are gratefully acknowledged. We appreciate the opportunity to participate in ozonesonde evaluations through the JOSIE outreach of WMO’s Global Atmospheric Watch (GAW) Project.
References
Diab, R.D., A. Raghunandan, A.M. Thompson, and V. Thouret, Classification of tropospheric ozone profiles based on MOZAIC aircraft data, J. Geophys. Res., submitted, 2002.
Fishman, J., C.E. Watson, J.C. Larsen, and J.A. Logan, The distribution of tropospheric ozone determined from satellite data, J. Geophys. Res., 95, 3599-3617, 1990.
Folkins, I., S.J. Oltmans, and A. Thompson, A relationship between convective outflow and surface equivalent potential temperatures in the tropics, Geophys. Res. Lett., 27, 2549-2552, 2000.
Folkins, I., C. Braun, A.M. Thompson, and J.C. Witte, Tropical ozone as an indicator of deep convective outflow, J. Geophys. Res ., 107, D13, DOI: 10.129/2001JD001178, 2002.
Hasebe, F. et al., Initial results from SOWER/Pacific 1998-2000 Campaign, Proceedings of the 2nd SPARC General Assembly , CD-ROM N°1, 2000.
Hudson, R.D. and A.M. Thompson, Tropical tropospheric ozone (TTO) from TOMS by a modified-residual method, J. Geophys. Res. , 103, 22129-22145, 1998.
Hudson, R.D., A.D. Frolov, M.F. Andrade, and M.B. Follette, The total ozone field separated into meteorological regimes. 1. Defining the regimes. J. Atmos. Sci., submitted, 2002.
Kirchhoff, V.W., Y. Sahai, and A.G. Motta, First ozone profiles measured with ECC sondes at Natal (5.9S, 35.2W), Geophys. Res., Lett., 8, 1171-1172, 1981.
Logan, J.A. et al., The quasi-biennial oscillation in equatorial ozone as revealed by ozonesonde and satellite data, J. Geophys. Res., DOI: 10.129/2002JD002170, in press, 2002.
Randel, W.J. et al., Trends in the vertical distribution of ozone, Science, 285, 1689-1692, 1999.
Shiotani, M., Annual, quasi-biennial, and El-Nino-Southern Oscillation (ENSO) time-scale variations in equatorial total ozone, J. Geophys. Res., 97, 7625-7633, 1992.
Thompson, A.M. et al., Where did tropospheric ozone over southern Africa and the tropical Atlantic come from in October 1992? Insights from the TOMS GTE/TRACE-A and SAFARI-92, J. Geophys. Res., 101, 24251-24278, 1996.
Thompson, A.M. et al., A tropical Atlantic ozone paradox: Shipboard and satellite views of a tropospheric ozone maximum and wave-one in January-February 1999, Geophys. Res. Lett., 27, 3317-3320, 2000.
Thompson, A.M. et al., The 1998-2000 SHADOZ (Southern Hemisphere ADditional Ozonesondes) tropical ozone climatology. 1. Comparison with TOMS and ground-based measurements, J. Geophys. Res., 107, DOI: 10.129/2001JD000967, in press, 2002a.
Thompson, A.M. et al., The 1998-2000 SHADOZ (Southern Hemisphere ADditional OZonesondes) tropical ozone climatology. 2. Tropospheric variability and the zonal wave-one, J. Geophys. Res., DOI: 10.129/2002JD002241, in press, 2002b.
Thompson, A.M. et al., Lusaka, Zambia, during SAFARI-2000: Convergence of Local and Imported Ozone Pollution, Geophys. Res. Lett., 29, 1976, DOI: 10.129/2002GL015399, 2002c.
WMO (World Meteorological Organization), “SPARC/IOC/GAW Assessment of Trends in the Vertical Distribution of Ozone,” ed. By N. Harris, R. Hudson and C. Phillips, SPARC Report No. 1, WMO Global Ozone Research and Monitoring Project, Report No. 43, Geneva, 1998
WMO/U. N. Environ. Prog., “Scientific Assessment of Ozone Depletion: 1998,” Report No. 44, WMO, Geneva, 1999.
Zachariasse, M., H.G. Smit, P.F. van Velthoven, and H. Kelder, Cross-tropopause and interhemisphericc transports into the tropical free troposphere over the Indian Ocean., J. Geophys. Res., 106, 28441-28452, 2001.
![]()