 |
Stratospheric Processes And their Role in Climate
|
||||||||
| Home | Initiatives | Organisation | Publications | Meetings | Acronyms and Abbreviations | Useful Links |
![]()
|
Stratospheric Processes And their Role in Climate
|
||||||||
| Home | Initiatives | Organisation | Publications | Meetings | Acronyms and Abbreviations | Useful Links |
![]()
Sachiko Hayashida, Nara Women’s University, Nara, Japan (sachiko@ics.nara-wu.ac.jp)
 |
 |
|
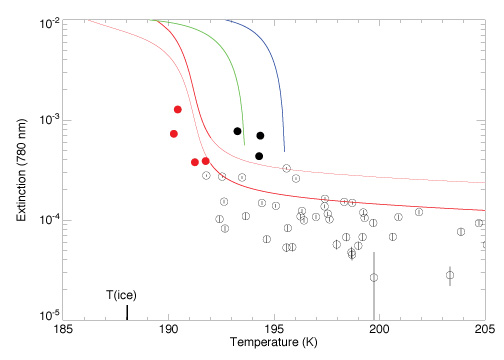
Fig. 1-a1
|
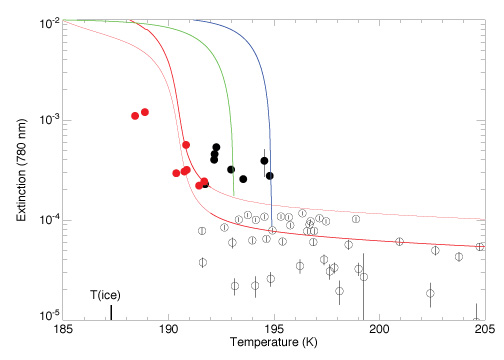
Fig. 1-a2
|
 |
 |
|
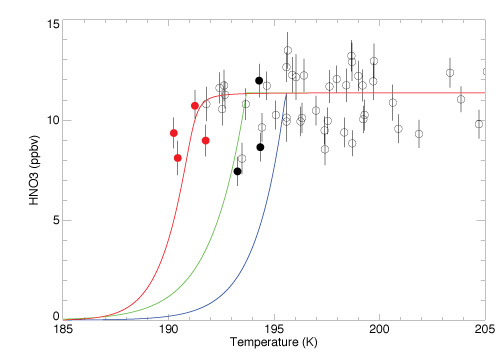
Fig. 1-b1
|
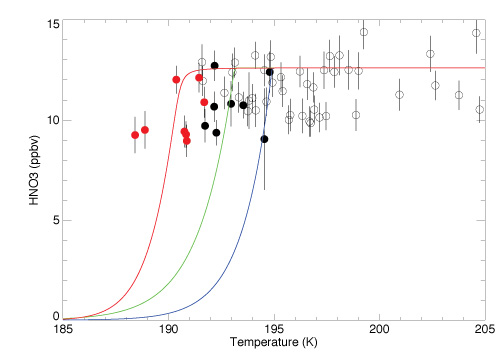
Fig. 1-b2
|
Figure 1: Scatter-plots of UKMO temperature vs. the ILAS extinction coefficient (a1, a2) and UKMO temperature vs. the ILAS nitric acid (b1, b2) at 20-km (a1, b1) and 21-km (a2, b2) in mid-January. Solid circles represent the data identified as PSCs, red ones are more likely to be STS considering the extension coefficient and nitric acid concentration. The theoretical curves for STS (red lines), NAD (green line), and NAT (blue line) are shown in the figure. Error bars on ILAS data are from data set of version 5.20. Details on the errors are described in Yokota et al., [2002]. |
|
|
(For a better resolution of the images, please click on the plot or contact the SPARC Office)
|
|
Figure 2 shows the vertical profiles of the extinction coefficient (solid line with a notation ‘E’), nitric acid (solid line with a notation ‘N’), and the collocated UKMO temperature (upper scale: ‘T’) on these two days. The 10-day averaged background profile of nitric acid for mid-January is also shown in the figure (dashed line). The black circles indicate the data that correspond to the STS formation curve. Comparison of the ILAS nitric acid profile with the background profile illustrates that nitric acid decreased significantly in the region where STS-PSCs was observed.
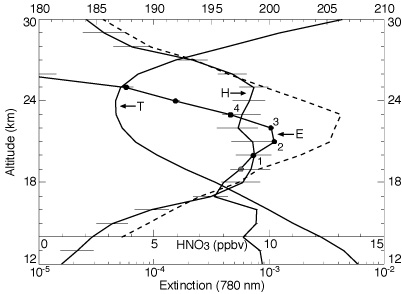 |
| Figure 2: The vertical profiles of the extinction coefficient (E), nitric acid (N), and collocated UKMO temperature (T) observed on January 19 (65.8 N, 21.6 E,). The 10-day averaged background profile of nitric acid for mid-January is also shown in the figure (dashed line). The black circles indicate the data that categorised as STS. |
|
(For a better resolution of the images, please click on the plot or contact the SPARC Office)
|
Recently, S. Oshchepkov (NIES) examined IR channel aerosol extinction data of ILAS in aerosol type analyses using a spectral fitting approach [Oshchepkov et al., 2002]. We are now continuing collaboration on this issue with Oshchepkov and the NIES group. Combined use of our approach with infrared spectral analysis will shed light on unknown microphysical processes of PSCs.
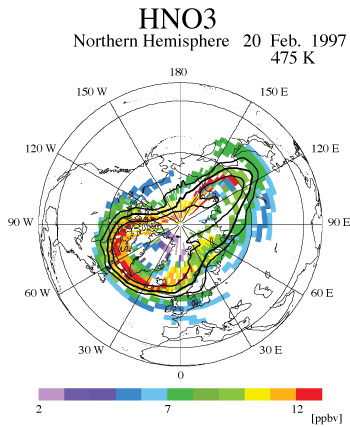
Finally, the effect of PSCs and denitrification on ozone loss was examined by means of our newly developed scheme named Chemical Species Mapping on Trajectories (CSMT) [Kagawa and Hayashida, 2002]. The CSMT is a method to construct synoptic maps of chemical species by combining ‘trajectory mapping’ [Morris et al., 1995, 2000] with a photochemical box model. Minor constituents are time-integrated in a photochemical box model along trajectories that start from satellite measurement points until a target time. In this study, we calculated 7-day forward trajectory for each observed data. The initial values of ozone, HNO3, and N2O at the initial trajectory points were taken from ILAS version 5.20 data. All other initial data were taken from the climatological data derived in a similar way to Becker et al. [2000]. Many long and short-lived species in the stratosphere were successfully mapped by the CSMT. Figure 3(a) and 3(b) are the examples among those maps for ozone and nitric acid on February 20, 1997 on 475-K isentropic surface. Though ILAS measurements are geographically limited, the CSMT scheme can be used to expand the area of data coverage, which furthers the potential of data usage.
 |
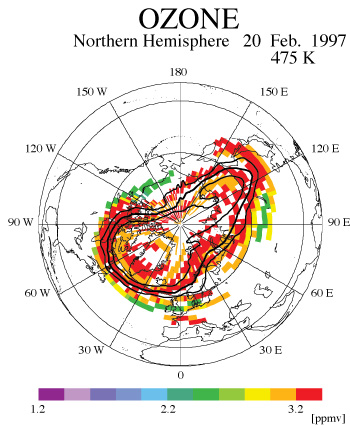 |
| Figure 3(a): A CSMT-derived ozone map on the 475-K isentropic surface on February 20, 1997. Colors indicate ozone-mixing ratios. Figure 3(b): Same as Figure 3(a) but for nitric acid. |
|
|
(For a better resolution of the images, please click on the plot or contact the SPARC Office)
|
|
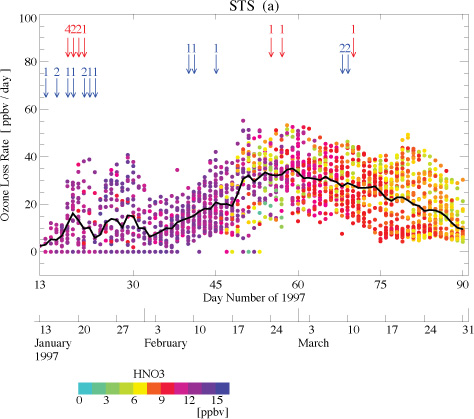 |
| Figure 4: Calculated ozone loss rate in ppbv/day. Ozone decrease is taken to be positive. Each dot indicates the ozone loss rate calculated for the target day along different trajectories. Ozone loss was estimated from the difference between the first calculated output of the target day and the value 24 hours later. The color indicates the corresponding nitric acid level. The arrows shown in the figure are the PSC events categorised with Saitoh et al., [2002]: red and blue arrows indicate STS and NAT with numbers of the events. |
|
(For a better resolution of the images, please click on the plot or contact the SPARC Office)
|
Becker, B. et al., Ozone loss in the Arctic stratosphere in the winter 1994/95: Model underestimate results of the Match analysis, J. Geophys. Res., 105, 15175-15184, 2000.
Hayashida, S., et al., Arctic polar stratospheric clouds observed with the improved limb atmospheric spectrometer during winter 1996/1997, J. Geophys. Res., 105, 24,715-24,730, 2000a.
Hayashida, S., et al., Stratospheric background aerosols and polar stratospheric clouds observed with satellite sensors – Inference of particle composition and sulfate amount, Soc. Photo Opt. Instrum. Eng., 4150, 76-86, 2000b.
Irie, H., et al., Redistribution of nitric acid in the Arctic lower stratosphere during the winter of 1996-1997, J. Geophys. Res., 106, D19, 23, 139-23,150, 2001.
Kagawa, A. and S. Hayashida, Analysis of ozone loss in the Arctic stratosphere during the late winter and spring of 1997, using the Chemical Species Mapping on Trajectories (CSMT) technique, J. Geophys. Res. (submitted).
Kondo, Y. et al., Denitrification and nitrification in the Arctic stratosphere during the winter of 1996-1997, Geophys. Res. Lett., 27, 337-340, 2000.
Morris, G.A., et al., Trajectory mapping and application to data from the Upper Atmosphere Research Satellite, J. Geophys. Res., 100, 16491-16505, 1995.
Morris, G.A., et al., A tool for validation of trace gas observations, J. Geophys. Res., 105, 17825-17894, 2000.
Oshchepkov, S. et al., Retrieval of stratospheric aerosol composition from spectral limb-scanning observations at the infrared gas window channels, J. Geophys. Res. (submitted)
Pan, L.L., et al., Satellite Observation of Dehydration in the Arctic Polar Stratosphere, Geophys. Res. Lett., GL014147, 2001.
Saitoh, S. et al., Characteristics of Arctic Polar Stratospheric Clouds in winter 1996/1997 inferred from ILAS measurements, J. Geophys. Res., 2002 (in press).
Sasano, Y. et al., Improved Limb Atmospheric Spectrometer (ILAS) for stratospheric ozone layer measurements by solar occultation technique, Geophys. Res. Lett., 26, 2; 197-200,.1999.
Tabazadeh, A. E. et al., Role of the stratospheric polar freezing belt in denitrification, Science, 291, 2591-2594, 2001.
Waibel, A.E. et al., Arctic ozone loss due to denitrification, Science, 283, 2064-2069, 1999.
WMO, Scientific Assessment of Ozone Depletion: 1998, Report n° 44.
Yokota, T. et al., Improved Limb Atmospheric Spectrometer (ILAS) data retrieval algorithm for Version 5.20 gas profile products, J. Geophys. Res., 2002 (in press).
![]()