 |
Stratospheric Processes And their Role in Climate
|
||||||||
| Home | Initiatives | Organisation | Publications | Meetings | Acronyms and Abbreviations | Useful Links |
![]()
|
Stratospheric Processes And their Role in Climate
|
||||||||
| Home | Initiatives | Organisation | Publications | Meetings | Acronyms and Abbreviations | Useful Links |
![]()
The stratosphere is characterised by strong stability (to vertical displacements), high ozone and low
water vapour, and the troposphere by weak stability, low ozone and high water vapour. The notional boundary
between the two, the tropopause, has several definitions (WMO standard definition based on lapse rate,
cold-point temperature, ozone tropopause, potential-vorticity definition, etc.), which are useful for different
purposes. In reality, the transition between troposphere and stratosphere occurs over a layer of finite thickness
and it is best to consider a tropopause region within which the different tropopauses corresponding to the different
definitions might be expected to fall. Transport across the tropopause region is mainly upwards in the tropics and
mainly downwards in the extratropics (the Brewer-Dobson circulation), but there is significant two-way transport,
particularly in the extratropics.
The tropopause region is a critical region for climate. Chemistry relevant to climate is highly dependent on the
OH radical, whose production is proportional to the product of ozone and water vapour and so is large in the tropopause
region. Chemical and radiative timescales are relatively long (see Figure 1),
which means that dynamical forcings (chemical transport and adiabatic warming or cooling) play a particularly strong
role in controlling the structure of the region. But equally, it means that chemical concentrations are affected even
by slow chemical processes, and temperature is highly sensitive to changes in radiative heating or cooling rates.
Low temperatures imply the importance of condensed matter (liquid and solid clouds and aerosols) in this region,
and therefore of heterogeneous and multiphase chemical reactions, as well as associated radiative effects. Finally,
the tropical tropopause temperature controls the amount of stratospheric water vapour through the freeze drying
mechanism. These factors all make the tropopause region particularly crucial for climate sensitivity. It should be
noted that current climate models, with vertical resolution of 1km or coarser, cannot resolve this region because
the transition between troposphere and stratosphere occurs over only a few km.
 |
||||
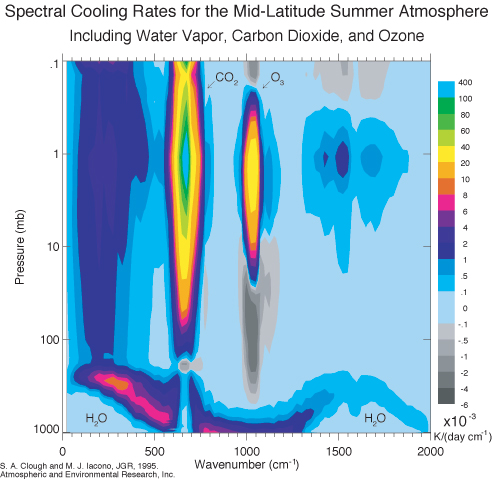
| Figure 1: Thermal infrared cooling rates for H2O, CO2 (355 ppm), and O3 as a function of wavenumber and pressure for mid-latitude summer conditions. Colour scale x 10-3 is in units of K d-1 (cm-1)-1. The figure demonstrates the special nature of the UT/LS region in the atmosphere's radiative balance. The band centred at 667 cm-1 is dominated by CO2, and exhibits strong stratospheric cooling (explaining why a CO2 increase leads to stratospheric cooling) but a local warming at the tropopause. The band around 1043 cm-1 is dominated by O3 and exhibits warming throughout the lower stratosphere. Water vapour makes a strong contribution to upper tropospheric cooling near 300 cm-1, although its effects are moderated by CO2. In the UT/LS region the thermal infrared warming and cooling effects tend to largely cancel, implying a strong radiative sensitivity to greenhouse gas changes. [Courtesy of M. Iacono, AER.] | ||||
Thus, the tropopause region exhibits a complex interplay between dynamics, transport, radiation, chemistry, and microphysics.
This is particularly highlighted in the case of ozone and water vapour, which provide much of the climate sensitivity in this
region.
Traditionally, atmospheric scientists have considered the tropopause region through a process-focused approach. The successful
NATO/SPARC workshop in Cambridge in 1993 on Stratosphere-Troposphere Exchange, which led to the highly influential
J. Holton et al. (1995) review paper, shifted the paradigm for exchange from local to global. However,
the focus was still very much on dynamics and transport. Now there is a need to link the dynamical/transport picture to climate,
which requires the inclusion of radiation and chemistry in the conceptual framework. Yet even some of the most basic questions
about the tropopause region remain unanswered. This means that there is a need to go back to fundamentals.
To address this need, SPARC convened a workshop (co-sponsored by NASA) on the tropopause, which was held in Bad Tölz,
Germany, from 17-21 April 2001. Its goal was to bring together a diverse group of scientists to consider various aspects of the
tropopause region: what it is, why it is what it is, how it affects climate, and how it might be expected to change in the future.
The group included expertise in dynamics, radiation, chemistry, and microphysics, and likewise expertise in measurements,
modelling, laboratory/field studies, and theory. The format was very open with a relatively small number of invited 'theme' talks,
of a review/tutorial nature, and with plenty of time for open discussion led by a 'provocateur'. The meeting concluded with a
half-day session led by 'rapporteurs' who synthesised the salient points of the earlier sessions. The main conclusions drawn
from the workshop are highlighted below.
Three other reports in this newsletter, written independently of the workshop (by H. Fischer et al.,
A. Gettelman et al. and S. Sherwood), are concerned with the tropopause region, and indeed the authors
were participants at the Bad Tölz workshop.
In a fundamental sense the troposphere is the part of the atmosphere in which the destabilising effect of solar heating of the
surface leads to weak static stability and turbulent thermal energy transport. The stratosphere is the region above in which
static stability is strong, thermal energy transport is relatively unimportant, and the dominant thermal balance is radiative.
The tropopause is then the upper boundary to the turbulent energy transport (T. Schneider).
In the tropics the turbulent energy transport is accomplished by moist convection. As pointed out by
I. Held (1982), in the extratropics it is more likely that the transport is accomplished
by baroclinic instability.
If this basic picture is accepted then there are inevitable consequences for chemical distributions. From a chemical perspective,
the stratosphere is a harsh UV environment, with relatively weak mixing and no rain-out, while the troposphere is a softer UV
environment, with strong mixing and rain-out (A.R. Ravishankara). Within the troposphere
the turbulence, be it convective or baroclinic, implies rapid contact with the surface. Chemical species which enter the atmosphere
at the surface (this includes water vapour) are therefore relatively abundant. In the stratosphere, on the other hand,
the chemical character of the air is likely to be very different, since the air has aged considerably since it left the
surface and it may also have visited chemical source and depletion regions in the middle and upper stratosphere.
It used to be believed that the troposphere was an ozone sink, but it has become very clear in recent years that there
is significant in-situ photochemical production (A.R. Ravishankara). In fact, typical estimates find that ozone
transport from the stratosphere, while enough to refresh the tropospheric ozone burden every six months, is only
about 10% of the photochemical production. (Of course some of the photochemical loss is closely coupled to
photochemical production, so this figure could be misleading.) The upper troposphere in particular appears to be very
chemically 'fertile' on account of the presence of the OH radical, which is delivered to the upper troposphere by
acetone (formaldehyde, methyl hydroperoxide and other species) in addition to the traditional ozone/UV/water source
(P. Wennberg, A.R. Ravishankara). Ozone is produced in the so-called 'smog reactions' involving CO
(hydrocarbon), OH, and NO.
The fact that some chemical species, particularly water vapour, are radiatively active implies that there is substantial
coupling of dynamics, transport and chemistry. It is essential to understand this coupling thoroughly in order to make
reliable predictions of future chemical-climate change (V. Grewe, D. Stevenson).
|
TROPOPAUSE ACRONYMS |
|
LRT |
Lapse-rate tropopause: the conventional meteorological definition of the tropopause, in both tropics and extratropics, as the base of a layer at least 2km thick, in which the rate of decrease of temperature with height is less than 2K/km. |
CPT |
Cold-point tropopause: the level of minimum temperature. This is useful, and also significant, in the tropics. |
TTT |
Tropical thermal tropopause: since in the tropics the LRT and the CPT are usually less than 0.5km apart (with the LRT the lower) we ignore the distinction between them and refer to the TTT. The TTT is typically at 16-17km. |
STT |
Secondary tropical tropopause: the level of maximum convective outflow, above which the lapse rate departs from the moist adiabat. The STT is typically at 11-12km. |
TTL |
Tropical tropopause layer: the region between the STT and the TTT. |
CSRT |
Clear-sky radiative tropopause: the level at which the clear-sky heating is zero. Below the CSRT there is descent on average (outside convective clouds). Above the CSRT there is ascent on average. The CSRT is typically at 14-16km. |
In the tropics, the cold-point tropopause (CPT) and the lapse-rate tropopause (LRT) are within 0.5km of each other
at about 16-17km(1) and have very similar temperatures, although the LRT is often ambiguous
(D. Seidel). As there is probably not a useful distinction to be made between them, we can just refer to
the tropical thermal tropopause (TTT). However, the TTT apparently has little significance in terms of the
radiative-convective balance. Observations show that the vertical profile of temperature in the tropics matches
that predicted by moist convective adjustment only up to about 11-12 km (which corresponds to the maximum
Hadley-cell outflow). E. Palmén & C. Newton (1969, Fig.4.7) identified this level as
the 'secondary tropical tropopause' (STT). Models of radiative-convective adjustment exhibit a similar structure,
with CO2 long-wave heating leading to a clear separation between the region of convective adjustment
and the TTT (J. Thuburn). The notion of a 'tropical tropopause layer' (TTL) between the TTT and the STT
was revived by M. Atticks & G. Robinson (1983) and, more recently, by
E. Highwood & B. Hoskins (1998). Based on the overall radiative-convective balance,
one might regard the TTL as being more stratospheric than tropospheric in character, and it has therefore also
been dubbed the 'substratosphere' (J. Thuburn).
(1) The altitude or potential-temperature values given here and below should be understood as rough values, which can be expected to vary with longitude and season
On the other hand, the TTL is certainly penetrated by deep convection. There is some debate about the highest altitudes
reached by convection, with evidence that it may go as high as 19km (q=420K),
well above the TTT (q=380K) (S. Sherwood). However such events
are very infrequent, and the frequency of convection drops rapidly with altitude above the STT (J. Holton).
TRMM measurements suggest that only about 0.1% of the tropics has convection reaching the TTT at any given time.
The distribution of convective penetration above the STT matches the distribution of equivalent potential temperature,
qe, in the boundary layer (I. Folkins). The STT
(11-12km, q=345K) corresponds roughly to the threshold value
of qe above which convective available potential energy
(CAPE) is positive and therefore deep convection is possible. The mode of the boundary-layer
qe distribution falls at about the same value and the
distribution is such that the frequency of convective penetration decreases rapidly as a function of
q for values greater than 345K. If one regards the stratosphere
as being the region unreachable by convection, then the tropopause height would depend on the tail of the distribution
of qe, but this would be an inherently fuzzy definition.
The upwelling Brewer-Dobson circulation in the tropical stratosphere is driven by a combination of effects including
wave drag, transient radiative driving, and the stratospheric (i.e. non-convective) Hadley circulation. The relative
role of these processes remains the subject of active research, although recent evidence suggests an important role
for synoptic-scale wave drag in the subtropical lower stratosphere (W. Norton), rather than the extratropical
planetary-wave 'pump' as had been previously proposed by J. Holton et al. (1995). This circulation
certainly extends into the troposphere, cooling and elevating the TTT (see Figure 2). But the driving
mechanisms do also, which makes any distinction between troposphere and stratosphere on this basis
problematical.
 |
||||
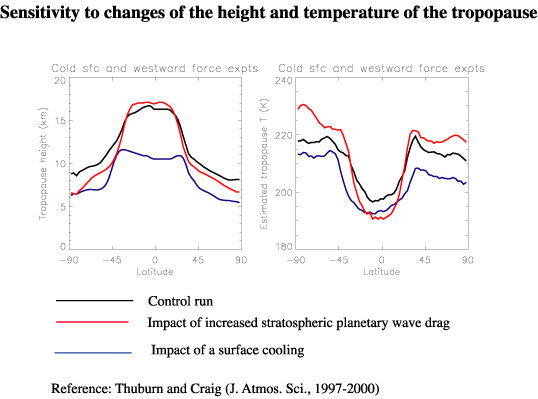
| Figure 2: Sensitivity of the height and temperature of the tropopause to idealised changes in a general circulation model. The dark curves show the control case. The red curves show the impact of increased stratosphericstratospheric planetary wave drag (extending into low latitudes) which acts to raise and cool the tropopause in the tropics and to lower and warm it in the extratropics. The blue curves show the impact of a surface cooling, which acts to lower and cool the tropopause everywhere, partly through the radiative effects of changes in stratospheric water vapour. The different character of the response to tropospheric and stratospheric changes is a useful fingerprint for attribution of observed changes. [Courtesy of J. Thuburn, University of Reading.] | ||||
Between qe=345K and about
qe=355K (corresponding to roughly 13-14km),
the rapidly decreasing likelihood of convection translates into a rapidly decreasing convective outflow at the
corresponding q values, and the clear-sky radiative cooling appears
to be essentially controlled by this outflow distribution (I. Folkins). This is the so-called 'mass flux scaling'
(see Figure 3(a)). Of course some of the outflow also has to supply the required background upwelling
(from wave drag, etc.), which leads to departures from mass-flux scaling. Recent calculations suggest that the
clear-sky radiative cooling equals zero at a level in the region 360-375K, 14-16km. If one regards a balance between
clear-sky radiative cooling and convective heating as the 'tropospheric' regime, and a balance between clear-sky
radiative heating and adiabatic cooling from upwelling as the 'stratospheric' regime, then evidently the troposphere
and stratosphere must overlap. However the rapid decrease with altitude of the convective outflow, and the rapid
increase of the background upwelling (because of the decreasing density with altitude), combine to make this
transition fairly sharp. Hence this level is another candidate tropopause, from a radiative-dynamical perspective,
which we might call the clear-sky radiative tropopause (CSRT). From this point of view the TTT lies entirely
within the stratosphere, and has no particular radiative-dynamical significance.
 |
||||
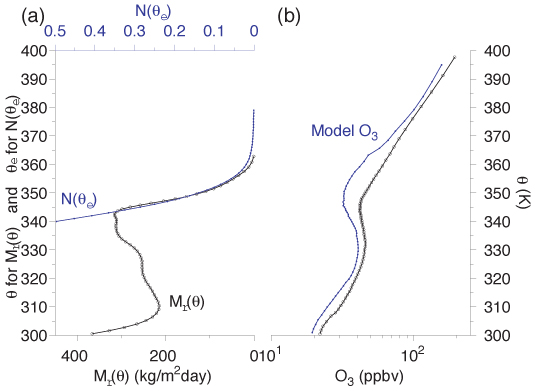
| Figure 3: (a) Clear-sky radiative mass flux Mr(q) and cumulative PDF of boundary-layer qe, N(qe). Mr is evaluated between 30°S and 30°N. N is evaluated between 15°S and 15°N below 700 hPa, and is normalised to be unity at 310K. Below 345K, Mr(qe) is unrelated to N(qe); this is the region of moist convective adjustment. Between 345K and about 355K, they are seen to match closely; this is the region of so-called 'mass flux scaling'. (b) Ozone profile predicted from a one-dimensional model incorporating vertical transport in clear-sky regions, convective outflow (in which ozone mixing ratio is set to 25 ppbv) and chemical ageing, together with all tropical ozonesondes (within 15 degrees latitude of equator) from SHADOZ. [Courtesy of C. Braun and I. Folkins, Dalhousie University.] | ||||
None of the various levels described above are material surfaces under adiabatic conditions, which means that they
are not transport barriers in any way (J. Thuburn, B. Legras). Thus the stratosphere and troposphere,
however defined, cannot be regarded as distinct air masses on an instantaneous basis. In the case of the TTT, for example,
the distribution of potential temperature q (which does represent a material
surface) at the TTT is a strong function of longitude (A. Gettelman), which means that air parcels close to the TTT
move in and out of the stratosphere and troposphere, reversibly, as they move around the equatorial belt. Large-scale tropical
waves, most notably Kelvin waves, further complicate this picture; the amplitude of Kelvin-wave effects on TTT parameters
can be double that of the annual cycle. Thus, one must be careful of labelling air as 'tropospheric' or 'stratospheric' based
on a sounding at a single location (K. Sato).
Below the STT, where moist convective adjustment holds, all air parcels have had recent contact with the boundary layer
and chemical species are fairly well-mixed. Above this level, in the TTL, convective timescales are longer than radiative
timescales (J. Thuburn) but all parcels, to the extent that the tropics are isolated, would have originated from
the tropical boundary layer. Convective upward transport is thus the key to the delivery of short-lived chemically active
species to the TTL. Chemical distributions in the TTL will then depend on the relative sizes of the convective timescales
(i.e. the timescale since contact with the boundary layer), chemical timescales (since chemical concentrations may change
through photochemical ageing), and timescales for lateral mixing with the extratropical lower stratosphere.
Above the CSRT, where the clear-sky mass flux is upwards, air parcels are on their way to the stratosphere (if they
are not considered to be in it already), in some mean sense. However, convective overshoots and breaking waves can
mix material downwards (S. Sherwood, M. Fujiwara), so one cannot say that air parcels are transported
irreversibly into the stratosphere until they get well above the CSRT, if not above the TTT. It is worth noting that even
if the region above the CSRT is 'stratospheric' from a radiative-dynamical perspective (because the net mass flux is upwards),
for a tracer with a large contrast between tropospheric and stratospheric values, even a small mass exchange with air below
the CSRT could be significant in which case the region might be regarded as 'tropospheric'.
A basic physical constraint on vertical transport is that air parcels must be heated in order for their potential temperature to
reach stratospheric values. This can be achieved by slow ascent and radiative heating (the Brewer-Dobson circulation perhaps
augmented by local radiative effects), or by overshooting cumulus followed by immediate mixing with relatively warm
stratospheric air (J. Holton). The importance of the latter is severely restricted by the constraints on deep
convection mentioned earlier. In any case the evidence from water vapour and cirrus clouds, discussed below, appears
to point to the dominant role of slow ascent.
It is when it comes to water vapour that the importance of the TTT manifests itself. A. Brewer (1949)
proposed the 'freeze drying' of air passing through the tropical CPT as the explanation for extreme stratospheric dryness,
and this hypothesis has stood the test of time remarkably well (M. Geller). (Strictly speaking the relevant level
would be where the water vapour saturation mixing ratio (over ice) is a minimum, not the CPT, but again we can just refer
to the TTT as a first approximation to this level.) Not only does the annually- and tropically-averaged minimum water
vapour saturation mixing ratio of about 3.8ppmv appear to correspond to the annual mean entry-level water vapour for
the stratosphere (A. Dessler), the annual cycle shows lowest values of water vapour occurring in NH winter
when the mean TTT temperatures are lowest, as manifested in the water vapour 'tape recorder' of
P. Mote et al. (1996). The strong nonlinearity of the Clausius-Clapeyron relation makes it difficult
to understand how the mean values of water vapour and temperature can correspond so well, given the longitudinal
and temporal variations in temperature. However, improving on the simple Brewer picture in a quantitative fashion
has proven to be remarkably difficult.
Because the lowest TTT temperatures occur over Indonesia, attention has historically focused on this region as the
controlling entry point to the stratosphere (J. Holton, M. Geller). The 'stratospheric fountain' of
R. Newell & S. Gould-Stewart (1981) hypothesised that most of the transport from troposphere
to stratosphere occurred in this region. However, this idea has now been largely superseded. The region immediately
above the TTT over Indonesia exhibits subsidence, so is, if anything, a stratospheric 'drain' rather than a 'fountain'
(S. Sherwood).
In the past, the lack of observed widespread cirrus clouds was taken as indirect evidence for the importance of condensation
and dehydration on the convective scale. However, recent evidence has accumulated of the existence of extensive subvisible
cirrus clouds in the tropics; Figure 4 shows an example of an 'ultrathin' cirrus cloud at 17km altitude observed in
the APE-THESEO campaign, having an optical density 300 times lower than the threshold for visibility from the ground
(T. Peter). Recent CHAMP (improved GPS-MET) measurements support this picture by confirming the existence
of widespread regions of low temperatures (C. Marquardt). Of course, dehydration is a continuous process,
with the relative importance of slow ascent versus convection varying with altitude through the TTL, but it now appears
possible that the 'final' dehydration (controlling the amount of stratospheric water vapour) is accomplished in slow
large-scale ascent. Such ascent combined with horizontal transport can, in principle, allow all air parcels to pass through
the region of lowest temperatures (J. Holton, S. Sherwood). In this case the location of the lowest
temperatures becomes largely irrelevant. Certainly single station measurements show no particular relation between
temperature and water vapour (M. Shiotani). However, the observed horizontal inhomogeneity of the water
vapour field above the TTT (K. Rosenlof) suggests that there are transport barriers associated with circulations
within the tropics, so that not all air parcels entering the stratosphere experience the lowest temperatures. It is not
until about q=450K, corresponding to an altitude of about 20km, that the
water vapour field becomes horizontally homogeneous. Further progress on this issue will likely require accurate parcel
trajectory calculations in the tropics, to assess the temperature history of ensembles of air parcels. Only with such
information will quantitative testing of Brewer's hypothesis be possible. The possible role of Kelvin waves, which are
observed to affect cirrus formation (K. Sato), may need to be considered in such calculations.
 |
||||
|
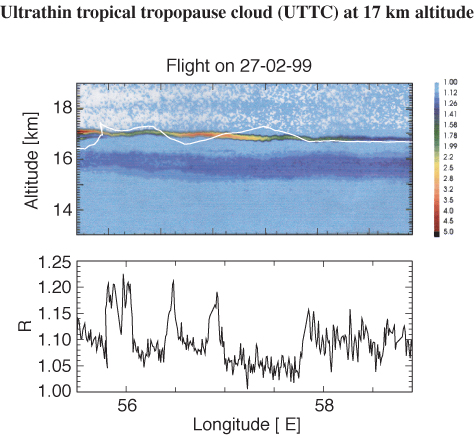
Figure 4: (top panel) Ultrathin tropical cirrus cloud at 10°S and 17km altitude, located about
300m below the CPT, detected through backscatter ratio at 1064nm measured by OLEX on the German research
aircraft Falcon during the APE-THESEO experiment in February 1999. (bottom panel) In situ measurements of backscatter ratio at 532nm measured by the aerosol sonde MAS on board the Russian high-altitude research aircraft Geophysica, whose flight track is indicated by the white line in the top panel. The cloud is only about 200-300m thick and has an optical density of about 10-4, 300 times lower than that required for visibility from the ground. These results suggest that thin, subvisible, cirrus clouds may be far more prevalent than previously imagined. Such clouds might be important for chemistry via heterogeneous reactions and possibly also for scavenging (e.g. of HNO3). The cloud at 17km carries very low concentrations of water and therefore does not by itself indicate that significant dehydration is occurring. However, modelling indicates that upon cooling the particles in the cloud can grow to much enhanced sizes. The dehydration effect would then be much more significant. [Courtesy of DLR Oberpfaffenhoffen, CNR Rome and the APE/THESEO community.] |
||||
But the assumption of 'freeze drying' occurring instantaneously and determined by local temperatures is itself also
clearly an oversimplification. Unless ice particles fall out, they will evaporate and re-moisten the air once it has left
the region of lowest temperatures. Thus the microphysics of dehydration is crucial to explain stratospheric dryness
(T. Peter). It is fair to say that the fall out of ice particles has not been satisfactorily explained. If the air is
clean (as one might imagine for slow ascent) then homogeneous nucleation is required, leading to large supersaturations.
Roughly speaking an additional 4K cooling is required for homogeneous nucleation, which would produce another 1ppmv
of water vapour compared to saturation values --- a discrepancy which would need to be accounted for (T. Peter).
Heterogenous nucleation would reduce supersaturations, but is not well understood at this time. Heterogeneous nucleation
is expected in convective overshoots, containing 'dirty' air from the boundary layer, but its extent in regions of slow
ascent remains to be ascertained.
From a chemical point of view, also, the TTL is a transition region with characteristics of both troposphere and stratosphere.
Indeed, measurements show that ozone increases with altitude throughout the TTL (M. Fujiwara), although there is a
notable jump in the vertical gradient of ozone at the TTT (J. Logan). This picture is entirely consistent with the
radiative-dynamical picture discussed above. Below the STT, air is well mixed, rain-out is effective, and ozone values
are low (and roughly independent of altitude). This is the pure troposphere, chemically speaking. Deep convection brings
low values of ozone from the lower troposphere into the TTL (M. Lawrence), together with short-lived species,
but following detrainment into clear-sky regions the ozone levels increase through photolysis as the parcels age
(I. Folkins). This effect together with the decreasing mass outflow with altitude combine to produce an ozone
profile remarkably like observations (see Figure 3(b)). Of course lateral mixing with ozone-rich air from the
lowermost stratosphere must have an effect on these profiles too (D. Waugh), but this effect is not well
estimated.
In addition to direct radiative effects through gas-phase species (principally ozone), chemistry affects the radiation
budget indirectly through the growth of aerosols. Organic aerosols are especially important in the TTL, where they
(and their precursors) are brought by convection and also produced in situ by the smog reactions (D. Worsnop).
The extent of the convective transport and the roles of both scavenging and rain-out in opposing such transport remain
significant uncertainties (C. Mari). This applies to gas-phase chemicals as well as aerosols.
The preceding considerations would suggest that, from a chemical perspective, the atmosphere becomes increasingly
'stratospheric' as altitude increases above the STT. However, because water vapour is so important for chemistry
(principally through its effect on OH), the TTT plays a distinguished role. To this one might add the chemical effects
of cirrus clouds, which are confined to the TTT and below. Because air is pretty much irreversibly transported to
the stratosphere once it gets 1km or so above the TTT, with no possibility of scavenging, the TTT essentially sets
the chemical lower boundary condition for the tropical stratosphere (P. Wennberg). In this sense the TTT
may be seen as a semi-permeable membrane, or trap door, that allows transport of air, but not water vapour, into
the stratosphere (A.R. Ravishankara).
The temperature and altitude of the STT are controlled by moist convective adjustment, and are dependent on the moist
static energy at the surface which is a strong function of temperature (B. Boville). Increasing the moist static energy
should lead to a higher and warmer STT, independently of anything that might happen in the TTL and above. In contrast, the
TTT reflects a balance of stratospheric and tropospheric radiative-dynamical processes, and its behaviour would appear
to be considerably more sensitive. Changes in stratospheric radiative properties should lead to a negative temperature-height
(T-z) correlation, and this is indeed observed following volcanic eruptions when the TTT descends and warms
(P. Forster). Upwelling from stratospheric wave drag effectively lowers the radiative equilibrium temperature
at the TTT, also leading to a negative T-z correlation (J. Thuburn). This is seen in Figure 2 and appears
to account for the negative T-z correlation seen in the annual cycle of the TTT as well as its QBO signal
(D. Seidel).
In contrast, changes in surface temperatures are predicted to lead to a positive T-z correlation at the TTT (see Figure 2).
If robust, this could provide a useful `fingerprint' to distinguish stratospheric from tropospheric driving. For example, it points
to the stratosphere being the cause of the annual cycle in TTT temperature, as argued originally by
E. Yulaeva et al. (1994). It would also explain why it is that the coldest TTT occurs over Indonesia while
the highest TTT occurs over South America and Africa (D. Seidel); land convection is much more energetic than
ocean convection, leading (perhaps indirectly) to a warmer and higher tropopause in the latter regions (L. Pfister).
(Note that this statement concerns only the radiosondes; the ERA-15 reanalyses have the coldest and highest TTT coinciding.)
On the other hand, the ENSO signal, which is presumably tropospherically driven, has a negative T-z correlation
(D. Seidel). This may point to the limitations of local considerations in trying to explain longitudinal differences;
in principle one should consider a Gill-like solution to localised convective forcing, which would describe the spatial response.
This might already help account for the fact that the lowest temperatures in Indonesia are not directly above the most
vigorous convection (L. Pfister, S. Sherwood, A. Gettelman).
GCM experiments with enhanced greenhouse-gas forcing produce a surface warming and therefore lead, by the above arguments,
to significant warming of the STT. However whilst surface warming has been observed, the warming at the STT has not,
which is something of a puzzle (B. Boville). The effects on the TTT from greenhouse-gas forcing depend sensitively
on the treatment of water vapour radiative effects in the GCM (something which is typically not done very accurately); e.g.
the NCAR CCM shows a warming, while most other GCMs show a cooling (P. Forster). Ozone changes are also expected
to provide a significant climate feedback near the TTT, but the feedback is definitely two-way and requires a chemical climate
model for its prediction. Increased emission of pollutants should increase upper tropospheric ozone, but greenhouse-gas induced
climate changes could well mitigate these changes through reduced PAN (which is highly sensitive to temperature) and reduced
CH4 (D. Stevenson). However, it must be said that there is a great deal of uncertainty attached to these
predictions. Probably we need to be able to explain the past record before we can take future predictions seriously
(A.R. Ravishankara, J. Logan).
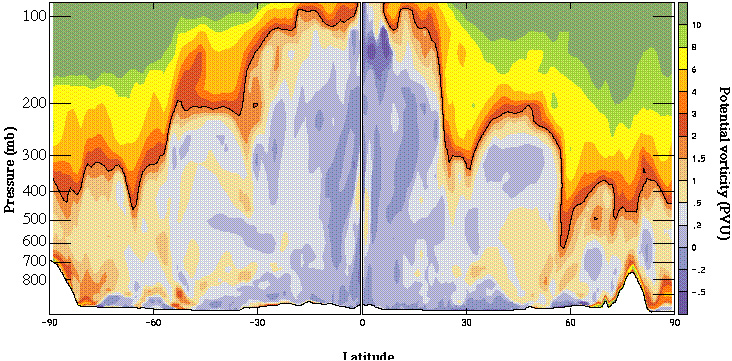
In the extratropics, as in the tropics, practical differentiation between troposphere and stratosphere may be on `meteorological' or chemical grounds. The WMO lapse-rate definition of the tropopause was formulated on the basis of extratropical observations and rarely fails badly in the extratropics. The lower stratosphere tends to be rather isothermal and this guarantees a transition between tropospheric lapse rate and zero lapse rate, but makes a CPT ambiguous. The lapse-rate criterion does sometimes fail in Antarctic winter, where the very low temperatures in the lower stratosphere may imply that lapse rates that are tropospheric according to the WMO criterion continue well into the stratosphere. More generally, multiple LRTs are often observed due to tropopause folding. One of the primary disadvantages of the lapse rate definition is that through purely reversible dynamical changes air may change from 'tropospheric' to 'stratospheric' and back again. This has motivated the definition of a 'dynamical' tropopause, based on potential vorticity (PV) value, since PV is materially conserved on adiabatic timescales. Because a jump in lapse rate corresponds to a jump in PV there is a relation between the two definitions, although they differ significantly in cyclones and anticyclones (V. Wirth). Various threshold values of PV have been used to mark the tropopause. This is a useful practical criterion and may be used as a basis for transport diagnostics (see later), but there is no reason why the tropopause should be marked by a single value of PV. Figure 5 shows a typical height-latitude cross-section of PV at one longitude, showing the tropopause as a potential vorticity contour.
 |
|||
| Figure 5: Instantaneous height-latitude cross section of potential vorticity along a single longitude (55W), with the tropopause marked (in black) as the 2PVU contour. The complex geometry of the tropopause associated with day-to-day variations in the circulation is evident, including upward doming associated with a subtropical anticyclone and downward intrusion and folding at higher latitudes. Courtesy of H. Wernli, ETH Zurich. | |||
Simple radiative models allow the tropopause height to be predicted in terms of the tropospheric static stability,
if the stratospheric radiatively determined temperature is known (G. Craig). However the static stability is
unknown a priori and must be predicted as part of any complete radiative-dynamical model for the tropopause.
Quantitative understanding of the extratropical tropopause remains inadequate, mainly because of this difficulty
and its close relation to the classical problem of baroclinic eddy parameterisation, i.e. predicting baroclinic heat fluxes
as a function of external parameters (G. Craig). Numerical experiments in simplified atmospheric models have
shown that baroclinic instability alone can provide the necessary heat transport and lead to a realistic tropopause
structure (P. Haynes, T. Schneider). Cleverly designed numerical simulations, e.g. in general circulation
models, have provided substantial insight in a more realistic context. For example, recent experiments by
Barry, Craig & Thuburn varied the strength of radiative heating terms and showed
that in the transition from the strong heating limit (in which the static stability tends towards dry neutral) to the
weak heating limit (in which the potential vorticity gradient on isentropic surfaces tends to zero), the corresponding
change in tropospheric static stability leads only to a modest change in tropopause height (from 7.5km to 11km).
In the extratropics the tropopause may sensibly be regarded as a permeable transport barrier marking the boundary
between different air masses. This is why a quasi-Lagrangian definition of the tropopause, e.g. based on a particular
value of PV, is useful.
Exchange across the tropopause in the extratropics is accomplished by processes on a large range of scales. Whilst net
exchange rates might best be considered as controlled by global-scale processes, as part of the Brewer-Dobson circulation,
two-way exchange occurs on synoptic and sub-synoptic scales and may have important consequences for chemical species.
Synoptic-scale disturbances frequently bring air from the boundary layer to the upper troposphere, leading to strong chemical
contrasts in the neighbourhood of the tropopause. Recent quantitative studies have reflected the fact that no single
measure of exchange is likely to be adequate. One approach is to use a hybrid Eulerian--Lagrangian quantification
in which fluxes across relevant control surfaces, such as the 1PV surface, are counted only if the corresponding
air parcels then stay in the stratosphere or the troposphere for a minimum time (H. Wernli).
Ozone is a convenient species to use as a chemical basis for differentiation between tropospheric and stratospheric air,
at least in winter when there is little photochemical production of ozone within the troposphere. Detailed analysis shows
that sharp vertical gradients of ozone are often co-located with sharp vertical gradients of static stability. Ozone profiles
often give a clear signature of the difference between tropospheric and stratospheric air in cases where the LRT is a poor
indicator (e.g. in cyclones). The ozone-defined tropopause defined by S. Bethan et al. (1996), on the basis
of observations primarily in winter and spring, appears to be located about 1km below the LRT (G. Vaughan).
Chemical measurements (e.g. of ozone and carbon monoxide) may be used to follow the transition across the tropopause
from air with a tropospheric character to air with a stratospheric character. In winter there is little evidence for
tropospheric air in the lowermost stratosphere (above 330K), suggesting that the extratropical tropopause is an effective
barrier to transport. In summer, on the other hand, air in the lowermost stratosphere has substantial tropospheric chemical
content indicating that the extratropical tropopause is a much less effective barrier to transport (although latitudinal
gradients of chemical species persist in the lower stratosphere through the summer) (H. Fischer).
(See Figure 2 of H. Fischer et al. in this issue.) These winter-summer differences inferred
from chemical evidence are consistent with passive tracer calculations using observed large-scale winds. They are
also consistent with the observed annual cycle of water vapour in the NH lowermost stratosphere, e.g. from POAM,
which shows the widespread presence of high values in summer (C. Schiller). It has been suggested that this
moistening arises through transport associated with the Asian summer monsoon. The possibility should not be ruled
out that convective penetration into the summertime lowermost stratosphere, e.g. associated with deep convection
over continents, may play an important role in the observed annual cycle of water vapour and other chemical species
(S. Sherwood). However the annual cycle of downwelling is also relevant; in winter the stronger downwelling
keeps the lowermost stratosphere dryer (C. Schiller).
As noted in the introduction, the upper troposphere is now understood to be far more chemically fertile than previously
believed. Relatively short-lived species such as acetone play a significant role in the in-situ production of ozone in the upper
troposphere. The possible impact of cirrus clouds on the ozone budget has yet to be determined. Nevertheless, if chlorine
is present it must be activated on cirrus, so this activation could be a useful diagnostic of cirrus clouds
(A.R. Ravishankara).
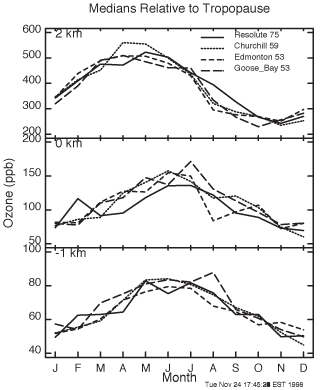
The seasonal cycle of ozone in the extratropics differs between lower stratosphere and upper troposphere. In the lower
stratosphere the maximum ozone mixing ratios are observed in spring, as a result of downward advection of high mixing
ratios by the winter Brewer-Dobson circulation. In the upper troposphere the maximum ozone mixing ratios are observed
in summer, possibly as a result of in-situ photochemical production. The stratospheric signal is clear 2km above the
thermal tropopause. The signal has a more transitional character 1km above and is tropospheric at the thermal
tropopause itself (J. Logan); see Figure 6. At first sight, this is difficult to reconcile with the location
of the ozone tropopause mentioned above, but the latter was determined without considering seasonal variation.
 |
||||
| Figure 6: Annual cycle of ozone in the extratropics as a function of altitude relative to the LRT. The dramatic increase in ozone mixing ratio with altitude from troposphere to stratosphere is evident. The lower stratospheric annual cycle, seen 2km above the LRT, has a maximum in March/April, whilst the tropospheric annual cycle, seen 1km below the LRT, has a maximum in June/July. The annual cycle at the LRT has the same phase as the tropospheric cycle. Courtesy of J. Logan, Harvard University (see Logan (1999) for further details). | ||||
Column ozone decreases have been observed in mid-latitudes over the last few decades. The major part of the observed
ozone trend occurs in the lowermost stratosphere, but in this region the budget of ozone is not well understood. Chemical
and transport timescales are roughly comparable, making the problem especially difficult. Transport is obviously crucial
to bring ozone to this region in the first place, but variations in transport are not well quantified. An important contribution
to the ozone trend in this region may come from a trend in the tropopause height itself (J. Logan). It is notable in
this respect that the ozone trends have significant longitudinal variations in this region.
Aircraft emissions of NOx in the upper troposphere/lower stratosphere region have been studied in detail and are
expected to lead to ozone increases in the lower stratosphere. Aircraft observations of chemical species show a great
deal of small-scale spatial structure, with transition from tropospheric to stratospheric characteristics over
horizontal scales of about 1km. There is almost certainly corresponding small-scale structure in water vapour.
Reproducing this structure and, perhaps more importantly, estimating its effects on the large scale is an outstanding
modelling problem (U. Schumann). Supersaturation with respect to ice is frequently observed in the
extratropics (U. Schumann, C. Schiller), though is not presently represented in analyses.
There may be local freeze drying in the extratropics, down to water vapour mixing ratios of less than
10 ppmv (C. Schiller).
Atticks, M. G., Robinson, G. D., 1983: Some features of the structure of the tropical tropopause. Q. J. Roy.
Meteorol. Soc., 109, 295--308.
Bethan, S., Vaughan, G., Reid, S. J., 1996: A comparison of ozone and thermal tropopause heights and the impact
of tropopause definition on quantifying the ozone content of the troposphere. Q. J. Roy. Meteorol. Soc.,
122, 929--944.
Brewer, A. W., 1949: Evidence for a world circulation provided by the measurements of helium and water
vapour distribution in the stratosphere. Q. J. Roy. Meteorol. Soc., 75, 351--363.
Clough, S. A., Iacono, M. J., 1995: Line-by-line calculation of atmospheric fluxes and cooling rates. II:
Application to carbon-dioxide, ozone, methane, nitrous-oxide and the halocarbons. J. Geophys. Res., 100,
16519--16535.
Held, I. M., 1982: On the height of the tropopause and the static stability of the atmosphere. J. Atmos. Sci.,
39, 412--417.
Highwood, E. J., Hoskins, B. J., 1998: The tropical tropopause. Quart. J. Roy. Meteorol. Soc., 124,
1579--1604.
Holton, J. R., Haynes, P. H., McIntyre, M. E., Douglass, A. R., Rood, R. B., Pfister, L., 1995: Stratosphere--troposphere
exchange. Revs. Geophys., 33, 403--439.
Logan, J. A., 1999: An analysis of ozonesonde data for the troposphere: recommendations for testing
3-D models and development of a gridded climatology for tropospheric ozone. J. Geophys. Res., 104, 16115--16149
Mote, P. W., Rosenlof, K. H., McIntyre, M. E., Carr, E. S., Gille, J. C., Holton, J. R., Kinnersley, J. S., Pumphrey,
H. C., Russell III, J. M., Waters, J. W., 1996: An atmospheric tape recorder: the imprint of tropical tropopause
temperatures on stratospheric water vapor. J. Geophys. Res., 101, 3989--4006.
Newell, R. E., Gould-Stewart, S., 1981: A stratospheric fountain. J. Atmos. Sci., 38, 2789--2796.
Palmén, E., Newton, C., 1969: Atmospheric circulation systems. Academic Press,
Yulaeva, E., Holton, J. R., Wallace, J. M., 1994: On the cause of the annual cycle in tropical lower stratospheric
temperatures. J. Atmos. Sci., 51, 169--174.
List of participants: M. Bourqui, B. Boville, J.-P. Cammas, G. Craig, V. Daniel, H. Davies, A. Dessler, G. Esler, V. Eyring, H. Fischer, I. Folkins, P. Forster, M. Fujiwara, A. Fusco, M. Geller, A. Gettelman, J. Gille, L. Goldfarb, V. Grewe, P. Haynes, J. Holton, P. James, D. Kley, M. Kramer, M. G. Lawrence, B. Legras, J. Logan, R. Mackenzie, C. Mari, C. Marquardt, P. Mascart, M. Milz, L. Moyer, R. Müller, W. Norton, L. Pan, T. Peter, D. Peters, L. Pfister, M. Ponater, A.R. Ravishankara, E. Ray, C. Reithmeier, G.-J. Roelofs, K. Rosenlof, K. Sato, C. Schiller, C. Schnadt, T. Schneider, U. Schumann, R. Scott, D. Seidel, T. Shepherd, S. Sherwood, M. Shiotani, E. Shuckburgh, P. Simon, L. Sparling, D. Stevenson, J. Thuburn, G. Vaughan, M. Volk, D. Waugh, P. Wennberg, H. Wernli, V. Wirth, D. Worsnop, A. Zahn.
![]()