 |
Stratospheric Processes And their Role in Climate
|
||||||||
| Home | Initiatives | Organisation | Publications | Meetings | Acronyms and Abbreviations | Useful Links |
![]()
|
Stratospheric Processes And their Role in Climate
|
||||||||
| Home | Initiatives | Organisation | Publications | Meetings | Acronyms and Abbreviations | Useful Links |
![]()
The stratosphere can be subdivided into the “overworld” and the “lowermost
stratosphere” (Holton et al., 1995). The lowermost stratosphere is defined as the volume of air between the local
tropopause and a potential temperature (Q) level (isentrope) of approximately
380 K, corresponding to the mean height of the tropical tropopause. The overworld represents the volume of stratospheric air
above this isentropic surface. In the large scale Brewer-Dobson circulation, tropospheric air enters the stratosphere predominantly
in the tropics, while stratospheric air returns to the troposphere at high latitudes. Although the net flux in the extratropics is from
the stratosphere into the troposphere, the exchange can take place in both directions. In general, the chemical trace gas composition
of the lowermost stratosphere is therefore a mixture of aged stratospheric air descending from the overworld through the 380 K
isentrope and recent injections of tropospheric air (here the “age” of stratospheric air refers to the time passed after
last contact with tropospheric air). The latter injections can be related to either diabatic processes, e.g. via mid- and high-latitude
convection, or adiabatic along isentropes across the tropopause, e.g. in the vicinity of tropopause breaks associated with the subtropical
and the polar front jet streams (Danielsen, 1968, Hoerling et al., 1993). This results in the formation of a mixing layer above the local
tropopause (Danielsen, 1968; Kritz et al., 1991; Hoerling et al., 1993; Ray et al., 1999; Fischer et al., 2000; Hoor et al., 2001).
Model studies indicate that bi-directional cross-tropopause transport at potential temperature levels of 340 – 360 K in the
vicinity of the subtropical jet is strongly inhibited in winter, while substantial exchange occurs at these altitudes in summer
(Chen, 1995; Haynes and Shuckburgh, 2000). These studies also indicate strong exchange below the 330 K isentropic surface during
all seasons, associated with synoptic disturbances at the polar front.
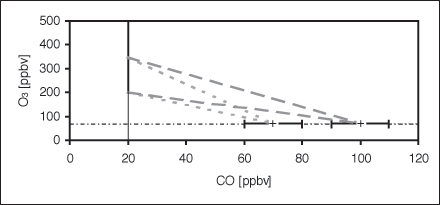
While chemical signatures from transport of stratospheric air into the upper troposphere are difficult to detect due to the rapid vertical mixing in the troposphere, the transport of tropospheric air into the lowermost stratosphere can be more easily identified from in-situ measurements of a large number of trace gases that exhibit a strong concentration gradient across the tropopause (e.g. H2O, N2O, CO, O3 and NOy, the sum of all oxidised nitrogen species except N2O). In particular, the slope of chemical tracer-tracer-relations in the lowermost stratosphere can be strongly affected by extratropical cross-tropopause transport (Hipskind et al., 1987; Fischer et al., 2000). This is illustrated in Figure 1 for the O3-CO relation. Hipskind et al. (1987) first used correlation of O3 and CO in the lower stratosphere and the marine troposphere to quantitatively describe the mixing between these two reservoirs in a tropopause fold. The mixing ratios of both species exhibit strong gradients at the tropopause, with high CO (low O3) values in the troposphere and low CO (high O3) values in the stratosphere. In general, the concentration of O3 strongly increases in the stratosphere, while its mixing ratio in the troposphere is relatively constant at levels smaller than approximately 100 ppbv. Sources of CO are primarily associated with combustion processes and hydrocarbon oxidation in the troposphere, leading to rather high concentrations of the order of 100 ppbv in the free troposphere of the northern hemisphere. Apart from extratropical stratosphere-troposphere exchange, the only source of CO in the stratosphere is the OH initiated oxidation of CH4. The produced CO is further oxidised to CO2 by reaction with OH, resulting in a rather constant mixing ratio of 10 to 20 ppbv in the overworld. Therefore, in the absence of cross-tropopause mixing, it is expected that simultaneous CO and O3 measurements should follow the L-shape indicated in Figure 1 (black lines). Mixing of tropospheric air into the lowermost stratosphere will result in deviations from this L-shape in the form of mixing lines connecting the chemical reservoirs of stratospheric and tropospheric air involved in the mixing process (dashed and dotted grey lines in Figure 1). The slope of the mixing lines is a function of the concentrations of CO and O3 in the tropospheric and stratospheric reservoirs. In general, the CO concentration in the northern hemisphere upper troposphere is a function of latitude, with higher concentrations at high latitudes. This is due to the large sources at high latitudes, and the strong sink in the tropics associated with high OH levels. Therefore we expect that mixing at the subtropical jet (dotted grey line) will result in a different mixing line compared to the polar jet (dashed grey line). In addition, the slope will significantly depend on the O3 concentration of the stratospheric reservoir. Fresh mixing events will produce a linear mixing line, while chemical ageing of mixed airmasses in the lowermost stratosphere will result in a non-linear mixing line due to the shorter photochemical lifetime of CO (~ 3 month) compared to O3 (~ 6 month) in this part of the atmosphere.
 |
||||
| Figure 1: Schematic representation of the influence of stratosphere-troposphere exchange on the O3-CO relation. The vertical line represents the stratospheric (overworld) reservoir, while the horizontal lines show the ranges for two different tropospheric reservoirs. Grey dashed and dotted lines indicate mixing between these reservoirs. | ||||
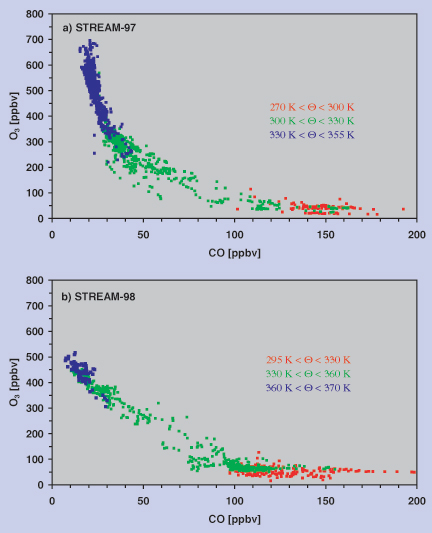
Figure 2 shows scatter plots of O3 versus CO obtained during two STREAM (Stratosphere Troposphere Experiments by Aircraft Measurements) campaigns from Kiruna, Sweden (68°N, 20°E) in early March 1997 (Figure 2a) and Timmins, Ontario Canada (48.2°N, 79.3°W) in July 1998 (Figure 2b). The winter data were obtained during four measurement flights covering an area extending from 2°E to 20°E and 68°N to 78°N up to a maximum altitude of 13 km. The summer campaign (8 flights) probed a region between 44° and 56°N and 71° to 90°W at similar altitudes. Both campaigns were performed in close proximity to the polar jet. The data in Figure 2 have been colour-coded with respect to potential temperature. In the troposphere at Q-levels less than approximately 300 K in winter and less than approximately 330 K in summer, CO mixing ratios in excess of 100 ppbv are found while the O3 mixing ratio is nearly constant at approximately 60 ppbv (red data points). As expected, the CO-O3 regression shows no correlation at all in the troposphere. For the Arctic STREAM campaign in March 1997 a strong negative relation between CO and O3 is observed for CO mixing ratios between 15 ppbv and approximately 30 ppbv (blue data points above the Q = 330 K level in Figure 2a), mixing ratios typical for aged stratospheric air. Cross-tropopause mixing can be identified by deviations from the L-shape for CO mixing ratios between about 30 and 100 ppbv (green data points in Figure 2a). During the summer campaign the purely stratospheric branch of the O3-CO correlation is almost missing (Figure 2b). Instead, the mixing line seems to extend to the highest O3 mixing ratios and to rather small values of CO, of the order of 10 to 15 ppbv. Hoor et al. (2001) have shown in more detail that in the winter season (Figure 2a) the mixing zone is restricted to potential temperature levels below approximately 330 K and does not extend beyond 20 K above the local tropopause. On the other hand, the summer measurements show that the mixing line reaches up to at least the 360 K potential temperature level, approximately 40 K above the local tropopause.
 |
||||
|
Figure 2: Scatter plots of O3 versus CO obtained during the STREAM measurement campaigns
in early March 1997 (a) and July 1998 (b). The colour coding refers to different potential temperature intervals. |
||||
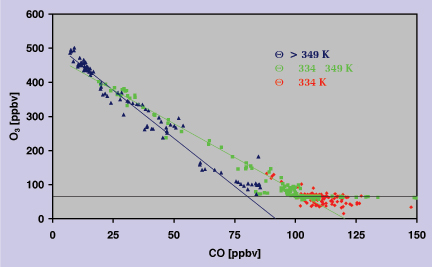
From Figure 2 we can estimate the CO and O3 concentrations for the stratospheric (transition from green to blue data points) and tropospheric (green to red data points) reservoirs involved in the mixing process. In the winter mixing occurs between a tropospheric reservoir of approximately ~120 ppbv CO and ~50 ppbv O3 and a stratospheric reservoir of ~30 ppbv CO and ~350 ppbv O3 (Figure 2a). During summer the tropospheric reservoir appears to contain between 100 and 120 ppbv CO at O3 levels of 60 ppbv. The stratospheric reservoir, representing descending airmasses from the overworld, is characterised by CO less than 20 ppbv and ~400 ppbv of O3. In particular the lower CO concentration indicates that the stratospheric reservoir in the summer is composed of older air masses compared to the winter season. This is confirmed by CO2 measurements indicating an airmass age of approximately 2 years for the summer measurements (Hoor et al., 2001). In general the mixing line for the summer season is very compact and linear, contrary to the mixing line observed for the winter season, which is slightly curved and exhibits more scatter. This indicates photochemical ageing of the air in the mixing layer during winter, while during summer the linear shape points to a rather continuous mixing process. Despite its compactness the mixing line for the summer season can be separated into two different lines. This is mainly due to data points obtained during the STREAM measurement flights on July 1 and 12, 1998, which have been performed on the cyclonic and anti-cyclonic side of the polar jet stream (Figure 3). The green data points, for a potential temperature interval between 334 and 349 K, seem to arise from mixing with a tropospheric reservoir characterised by ~110 ppbv CO and ~70 ppbv O3. These values agree very well with upper tropospheric measurements during STREAM 98 for airmasses with a polar background, as indicated by 5-day backward trajectories. The blue data points in Figure 3 (Q > 349 K) seem to result from mixing with a tropospheric reservoir with significantly less CO (~75 ppbv), indicating a more southerly subtropical/tropical origin of these airmasses.
 |
||||
|
Figure 3: Scatter plot of CO and O3 for the flights on July 1 and 12, 1998. Colours represent potential
temperature. Note the different slopes of the stratospheric mixing lines for different
Q intervals, suggestive of different tropospheric reservoirs. |
||||
This finding is consistent with a seasonal variation of cross-tropopause exchange at the subtropical jet as predicted by model studies (Chen, 1995; Haynes and Shuckburgh, 2000). Although the two STREAM campaigns have been performed in different locations, they both took place in close proximity to the polar jet stream. It seems that transport of tropospheric air into the lowermost stratosphere at potential temperature levels less than 330 K, associated with exchange across the mid-latitude polar jet, is found in both seasons. In the summer season, additional exchange occurs at the subtropical jet, mixing low latitude airmasses from the troposphere into the lowermost stratosphere up to potential temperature levels of approximately 360 K.
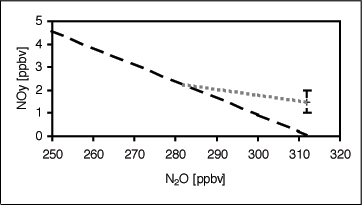
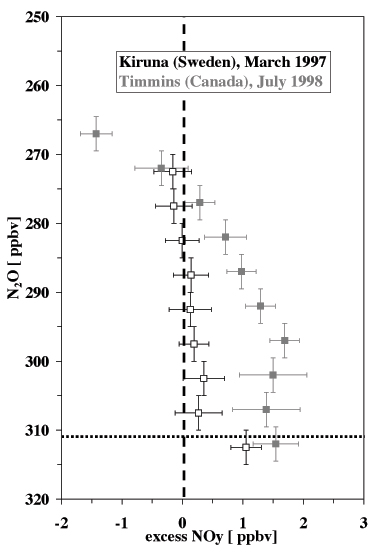
The identification of the mixing layer is not restricted to investigations of the O3-CO relationship. Other studies used in situ measurements of radioactive tracers (Kritz et al., 1991), H2O (Dessler et al., 1995, Hintsa et al., 1998), CFCs, SF6 and CO2 (Ray et al., 1999) and the NOy-N2O relation (Fischer et al. 2000). In particular the ratio between total reactive nitrogen (NOy = NO + NO2 + NO3 + 2 N2O5 + HONO + HNO3 + PAN + particulate nitrate) and NOy*, a proxy for NOy produced in the overworld by photochemical destruction of N2O, is very sensitive to additional NOy mixed into the lowermost stratosphere during cross-tropopause exchange processes (Fischer et al., 2000). This is illustrated in Figure 4. In the overworld NOy has been found to be anti-correlated with N2O following the linear relation NOy = (312.7 – N2O) x 0.073 (50 < N2O < 310 ppbv; dashed line in Figure 4) (Keim et al., 1997). Therefore, N2O measurements can be used to calculate the amount of NOy produced in the stratosphere descending from the overworld into the lowermost stratosphere. Mixing between stratospheric air and tropospheric air can result in deviations from this linear behaviour (dotted line in Figure 4), in particular if the NOy concentration in the upper troposphere is high, e.g. by convective transport from the polluted continental boundary layer, lightning or aircraft emissions of NOx. Figure 5 shows data obtained during the two STREAM campaigns discussed in the previous section. The difference between the in situ measurements of NOy and NOy* has been plotted against N2O, which is used here as an altitude proxy above the tropopause. An N2O value of ~312 ppbv is representative for the well-mixed troposphere. Average concentrations of NOy in the upper troposphere were of the order of 1 ppbv during STREAM 97, and approximately 1.5 ppbv during STREAM 98 (data points below the dotted horizontal line in Figure 4). Cross-tropopause mixing results in an enhancement of NOy in the lowermost stratosphere. In the winter season this enhancement is small and restricted to N2O mixing ratios less than 300 ppbv, corresponding to Q-levels of less than 330 K. In agreement with the findings of Figure 2, excess NOy is found up to much higher levels in the lowermost stratosphere during the summer campaign (N2O < 280 ppbv corresponding to Q-levels of ~360 K). Also the absolute amount of the excess NOy is much higher in summer compared to the winter season. This is due to the higher tropospheric NOy concentrations observed over Canada in July 1998, reflecting strong upward NOx transport and lightning production in thunderstorms.
 |
|||||||
| Figure 4: Schematic representation of the influence of stratosphere-troposphere exchange on the NOy-N2O relation. The dashed line has been calculated from ER-2 measurements (Keim et al., 1997) and represents overworld conditions. In particular during summer upper tropospheric NOy can be strongly enhanced (vertical bar at N2O = 312 ppbv). Cross-tropopause transport of tropospheric air into the lowermost stratosphere can cause excess NOy within the mixing region (grey dotted line). | |||||||
 |
|||||||
| Figure 5: Average excess NOy (= NOymeasured–NOy*) versus N2O. The vertical error bars represent the N2O ranges used to bin the data. The horizontal bars indicate the 1 s-standard deviation. Note that the two data sets have been vertically shifted by 2 ppbv to avoid overlap of the error bars. The horizontal dotted line indicates the tropospheric N2O mixing ratio of 312 ppbv. NOy values below this line represent upper tropospheric measurements. | |||||||
Trace gas measurements of CO, N2O, NOy, and O3 in the lowermost stratosphere in March 1997 and July
1998 confirm the existence of a mixing layer above the local tropopause up to potential temperature levels of ~330 K and ~360 K,
respectively. Above this layer, levels of trace gases and correlation have signatures typical for the overworld, notably very low
CO mixing ratios of about 20 ppbv. Adiabatic transport from mid-latitudes, in particular isentropic troposphere to stratosphere mixing,
is restricted to the Q < 330 K layer in the winter season, associated with exchange
near the polar jet. During summer additional exchange across the subtropical jet is most probably responsible for the extension of
the mixing layer to higher potential temperature surfaces (~360 K). This picture is consistent with recent model studies (Chen,
1995; Haynes and Shuckburgh, 2000), indicating a strong seasonal variation of cross tropopause exchange above 330 - 340 K.
Unfortunately, the STREAM measurements have been performed at different latitudes, so that a latitudinal dependency of cross
tropopause exchange can not be excluded as the cause of the observed differences between Stream 97 and STREAM 98.
Additional information will be gained from a forthcoming project (SPURT), supported by the German Federal Ministry for
Education and Research (BMBF), in the next 3 years. Within SPURT a total of 8 measurement campaigns will be performed
in the lowermost stratosphere (up to 14 km), covering the latitude range from 28° - 78°N along the western border
of Europe, during all seasons. On board a Learjet 35A, high precision measurement of CO, N2O, CH4,
CO2 (MPI-Mainz, PI: H. Fischer), H2O, O3 (FZ Jülich, PI: C. Schiller), F11, F12,
SF6 (University of Frankfurt, PI: A. Engel, U. Schmidt), NO and NOy (ETH Zürich, PI: T. Peter) will be performed.
For the data interpretation and evaluation an idealised mechanistic tropopause model (University of Mainz, PI: V. Wirth),
a lagrangian chemistry transport model (FZ Jülich, PI: C. Schiller) and a 3D chemistry-transport model (MPI-C, PI:
J. Lelieveld) will be used. It is expected that this project will further improve our understanding of
stratosphere-troposphere-exchange at mid-latitudes.
Chen P., Isentropic cross-tropopause mass exchange in the extratropics, J. Geophys. Res., 100, 16661-16673, 1995.
Danielsen E.F., Stratospheric-tropospheric exchange based upon radioactivity, ozone, and potential vorticity, J. Atmos. Sci., 25, 502-518, 1968.
Dessler A.E., E.J. Hintsa, E.M. Weinstock, J.G. Anderson and K.R. Chan, Mechanisms controlling water vapor in the lower stratosphere: "A tale of two stratospheres", J. Geophys. Res., 100, 23167-23172, 1995.
Fischer H., F.G. Wienhold, P. Hoor, O. Bujok, C. Schiller, P. Siegmund, M. Ambaum, H.A. Scheeren, and J. Lelieveld, Tracer correlations in the northern high latitude lowermost stratosphere: Influence of cross-tropopause mass exchange, Geophys. Res. Lett., 27, 97-100, 2000.
Haynes P, and E. Shuckburgh, Effective diffusivity as a diagnostic of atmospheric transport, 2. Troposphere and lower stratosphere, J. Geophys. Res., 105, 22795-22810, 2000.
Hintsa E.J., K.A. Boering, E.M. Weinstock, J.G. Anderson, B.L. Gary, L. Pfister, B.C. Daube, S.C. Wofsy, M. Loewenstein, J.R. Podolske, J.J. Margitan, and T.P.Bui, Troposphere-to-stratosphere transport in the lowermost stratosphere from measurements of H2O, CO2, N2O and O3, Geophys. Res. Lett., 25, 2655-2658, 1998.
Hipskind, R.S., G.L. Gregory, G.W. Sachse, G.F.Hill, and E.F. Danielsen, Correlations between ozone and carbon monoxide in the lower stratosphere, folded tropopause, and maritime troposphere, J. Geophys. Res., 92, 2121-2130, 1987.
Hoerling M.P., T.K. Schaack and A.J. Lenzen, A global analysis of stratospheric-tropospheric exchange durin northern winter, Mon. Wea. Rev., 121, 162-172, 1993.
Holton J.R., P.H. Haynes, M.E.McIntyre, A.R. Douglass, R.B.Rood and L.Pfister, Stratosphere troposphere exchange, Rev. Geophys., 33, 403-439, 1995.
Hoor, P., H. Fischer, L. Lange, J. Lelieveld, and D. Brunner, Seasonal variations of a mixing layer in the tropopause region as identified by the CO-O3 correlation from in-situ measurements, submitted to J. Geophys. Res., 2001.
Keim E.R., M. Loewenstein, J.R. Podolske, D.W. Fahey, R.S. Gao, E.L. Woodbridge, R.C. Wamsley, S.G. Donnelly, L.A. Del Negro, C.D. Nevison, S. Solomon, K.H. Rosenlof, C.J. Scott, M.K.W. Ko, D. Weisenstein, and K.R. Chan, Measurements of the NOy-N2O correlation in the lower stratosphere: Latitudinal and seasonal changes and model comparisons, J. Geophys. Res., 102, 13193-13212, 1997.
Kritz, M.A., S.W. Rosner, E.F. Danielsen and H.B. Selkirk, Air mass origins and troposphere-to-stratosphere exchange associated with mid-latitude cyclogenesis and tropopause folding inferred from 7Be measurements, J. Geophys. Res., 96, 17405-17414, 1991.
Ray E.A., F.L. Moore, J.W. Elkins, G.S. Dutton, D.W. Fahey, H. Vömel, S.J. Oltmans, and K.H. Rosenlof, Transport into the
the northern hemisphere lowermost stratosphere revealed by in situ tracer measurements, J. Geophys. Res., 104, 26565-26580,
1999.
![]()