 |
Stratospheric Processes And their Role in Climate
|
||||||||
| Home | Initiatives | Organisation | Publications | Meetings | Acronyms and Abbreviations | Useful Links |
![]()
|
Stratospheric Processes And their Role in Climate
|
||||||||
| Home | Initiatives | Organisation | Publications | Meetings | Acronyms and Abbreviations | Useful Links |
![]()
The year 2000 Antarctic ozone hole event had peculiar characteristics. The most outstanding are:
The ozone hole extent began, at a rapid growth about the middle of August, reaching an initial peak of 25 million km2, i.e. about as large as the 1999 event, on August 20/21, followed by a sudden decrease and a another rapid growth until it reached the maximum extent, close to 30 million km2 on September 9/10 (Figure 1). It is important to remember that the 1999 event reached its maximum extent between September 14 and 16, 1999 and the TOMS climatology shows that previous events had reached their peak size during late September and early October. Hence this year’s event grew beyond previous recorded extremes about three weeks earlier than in 1999 and reached its peak, also three weeks before the climatological mean timing and one week earlier than the 1999 event.
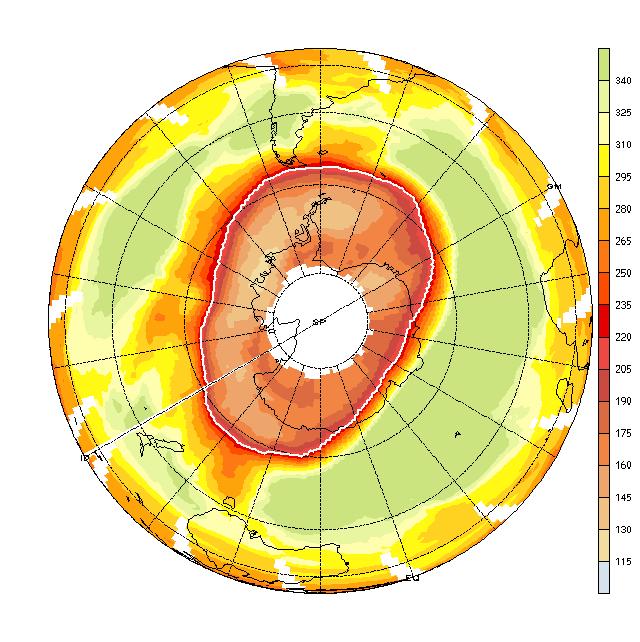
Figure 1. Map of the total ozone over the Southern Hemisphere, on September 10, 2000, as seen by EP-TOMS. On this day the ozone hole reached its largest size on record. The white line shows the 220 DU isoline. Values larger than 340 DU are not shown.
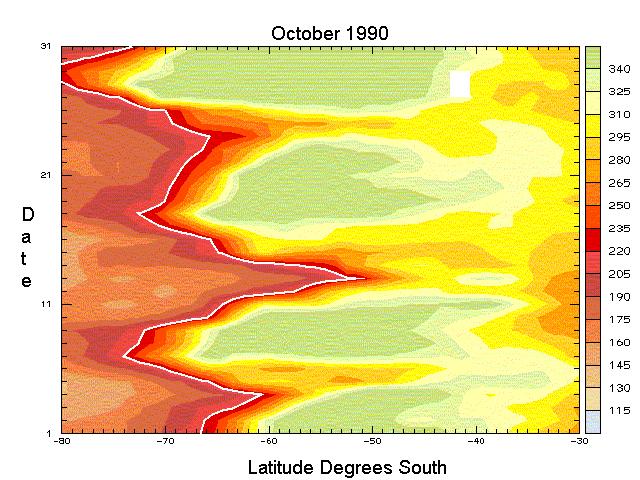
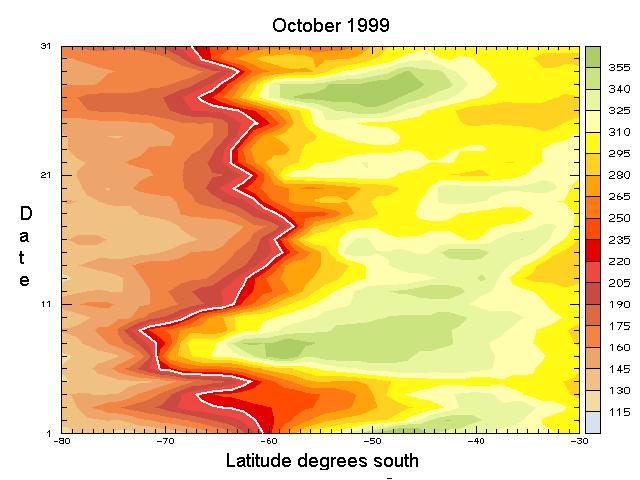
As can be seen in Figure 1, the shape of this ozone hole was significantly elliptic during most of the period. For example, during September 15, the 220 DU isoline reached 50ºS, over the central south Pacific. On October 12 and 18 the 220 DU isoline reached close to 48-47ºS over Southern Chile and Argentina. The dynamics of the ozone hole was significantly perturbed throughout the period of its existence. Figure 3 show the mean ozone levels between 80 and 30ºS averaged for the 60-70ºW longitude band, i.e. Southern Argentina and Chile, during 1990, 1999 and 2000. 1990 was chosen as an example of another dynamically perturbed ozone hole, while 1999 showed a far more stable behaviour. It is clear that the year 2000 was probably the most perturbed on record as can be seen in Figure 3 c). Normally as the ozone hole rotates, elongation towards mid-latitudes takes place, more commonly between the South Pacific and the South Atlantic. These are separated by 8 to 16 days, as can be seen in Figure 3 a). The year of 2000 however, and particularly in October, the elongations were far more frequent and did not follow the "rotation" of the ozone hole. In other words the shape of the hole was not elliptic during these events, but quasi-triangular.
 |
 |
| 3a | 3b |
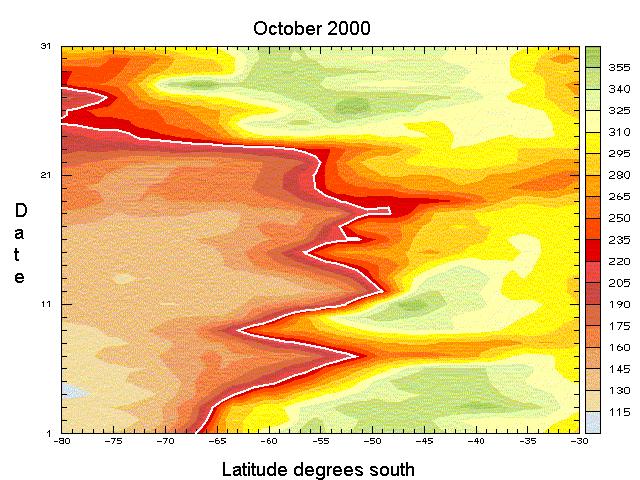 |
Figure 3. Evolution of the ozone layer between 30° and 80°S during a) October 1990, b) October 1999, c) October 2000, averaged between 60° and 70°W, i.e. over Southern Chile and Argentina. The white line shows the 220 DU isoline |
|
|
Furthermore the hole was very much displaced towards South America as can be seen in Figure 2, which shows the mean state of the ozone layer between October 6 and 20, 2000. On the other hand, peak values above 430 DU were observed south of Australia. In other words the ozone distribution over the hemisphere was quasi-bipolar. This implies that there was a very strong quasi-stationary wave one event. The significant eccentricity of the ozone hole behaviour coupled with important perturbations and deformations of the ozone hole resulted in a behaviour completely anomalous. Indeed in previous years the excursions of the ozone hole outside the polar region were not so prolonged in time, as can be seen in Figure 3 for 1990. It must be noted however that because of cloud cover only during a few days of this very low ozone period did the surface UV levels rise significantly above average. Observations from the Servicio Meteorológico Nacional UV network show that during clear days UV levels over Ushuaia (54.5ºS) were equivalent to those observed in Buenos Aires (34.5ºS) or Córdoba (32ºS) during January. While such levels can be tolerated by human beings they are significantly high for the local terrestrial and marine ecosystems. It must be noted that there were reports of sunburns in Ushuaia as well as Punta Arenas from people unaccustomed to such sudden changes in UV levels.
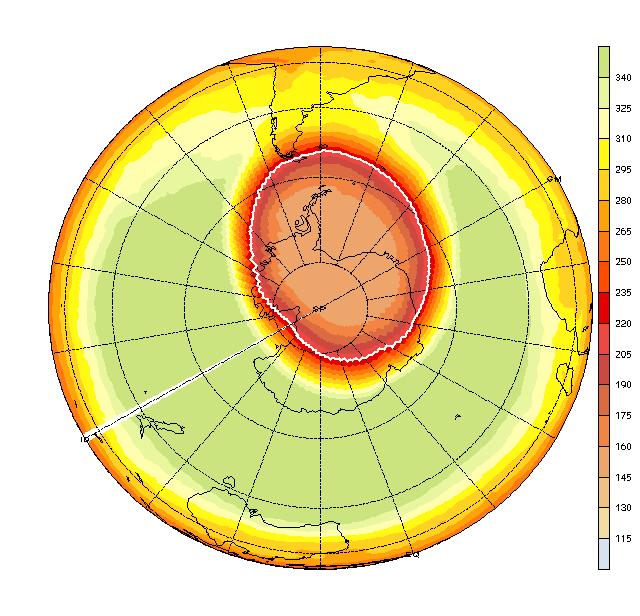
Figure 2. Mean total ozone over the Southern Hemisphere between October 6 and 20. Note the displacement of the ozone hole and how it covers at least half of Tierra del Fuego during this fortnight.
Though the size of the hole has significantly decreased after the peak in September, after October 20 the ozone hole begun a very rapid, sustained decrease in size, closing between November 20 and 25. The size of the hole during this period was within the TOMS climatology and far smaller than the records for the '90s. This was the earliest break-up since 1991. Furthermore it took place almost a month earlier than in 1998 or 1999. The comparison of figure 3 a) b) and c) and observations of the corresponding ozone fields show that the perturbed dynamics of this year’s event and the excursion to mid-latitudes with higher solar radiation levels are the probable causes of such an early break-up. The 1999 event with a more stable behaviour and fewer deformations lasted much longer. 1990 and 1991, which were also significantly perturbed, also had a relatively earlier break-up. Nevertheless it must be noted that those break-ups were not separated by so many days from those in other years as was the case this time.
The reasons for the ozone hole behaviour in 2000, in particular the early rapid growth, may be linked to the mean prevailing weather in the troposphere. The year 2000 has been the wettest in many parts of the Pampas region in Argentina since 1860. The winter 2000 was among the coldest and longest in recent years. Exactly what mechanisms led to this rapid growth and the huge size of the hole is currently under study. At this stage, the implications of the year 2000 event for the future behaviour of the ozone hole remain uncertain.
![]()