 |
Stratospheric Processes And their Role in Climate
|
||||||||
| Home | Initiatives | Organisation | Publications | Meetings | Acronyms and Abbreviations | Useful Links |
![]()
|
Stratospheric Processes And their Role in Climate
|
||||||||
| Home | Initiatives | Organisation | Publications | Meetings | Acronyms and Abbreviations | Useful Links |
![]()
Temperature information on the lower arctic stratosphere is now available for 45 winters, and information on the main state of the stratosphere since 1952 when Scherhag discovered the Stratospheric Midwinter Warmings. It is well known that the interannual variability of the stratospheric circulation during the arctic winters is very large, that very cold as well as very warm winters are observed and that it is very difficult to identify temperature trends.
In this short report we want to summarise the observations during the last 49 winters, based mainly on the historical daily analyses of radiosonde observations made at the Freie Universtaet Berlin (FUB) which is the longest data set available. We are using the monthly mean 30 hPa temperatures over the North Pole as a key parameter to describe the general state of the Arctic since the winter of 1955/56, Table 1. Here, RJ is the monthly mean of the sunspot numbers in January, in the column marked QBO the phase of the Quasi-Biennial Oscillation is indicated (determined using the winds between 50 and 40 hPa in January-February), and FW gives an indication of the timing of the Final Warmings which are the transitions from the winter to the summer circulation. CW stands for Canadian Warmings and * indicates the occurrence of a Major Midwinter Warming. Cstands for a cold monthly mean (about half a standard deviation below the average) and the definition for this is based on the 30-year monthly means, also given in the table. The values of the linear trend (K/decade) for the whole period and the confidence level in % are given at the bottom of Table 1.
Early Winter: The clearest change in temperatures and circulation took place in November. Starting with the winter 1981/82, almost all temperatures in the Table are marked with a C which is based on the 30-year mean, but the average of the last 15 years is with -71.5¡C almost 3 degrees colder than the 30-year mean, and the C must be newly defined. At the same time, the Canadian Warmings which in November/December took place in 18 of the 31 years until 1981/82, are missing during the last 18 winters, except for 2 cases. This hints to a change in the meteorological conditions of the troposphere, as Canadian Warmings are connected with the intensification of the stratospheric Aleutian high (see insert below) which is again connected with the Aleutian low in the troposphere. The last 15 Decembers have been sometimes very cold, but also 2 Major Mid-winter Warmings took place, a feature not observed before, and in total for 45 winters the monthly mean average for December remains the same as for the 30 years before.
Mid-winter: In the 34 years from 1952 to 1985, 6 Major Warmings took place in January and 8 in February; there were no major warmings in December. During the last 15 years, we observed only 1 Major Warming in January - but 2 in December (!), and 3 in February. It is tempting to speculate that there were significantly fewer Major warmings in mid-winter during the last 15 winters, but if one counts these events for 3 winter months, the result is not convincing. Really striking is the fact that there was a period of 7 winters without Major Warmings.
Factors influencing the state of the stratospheric circulation are the Southern Oscillation (SO) and the North Atlantic Oscillation (NAO), not dealt with here, and the QBO and the 11-year solar cycle (Labitzke, 1987; van Loon and Labitzke, 2000). The QBO determines the character of the early winter, leading to a colder and more stable polar vortex in December and January during the west phase of the QBO and a more disturbed and warmer Arctic during the east phase of the QBO. The solar cycle influences the latter part of the winters when a clear difference is observed between periods of high and low solar activity. During high solar activity the winters in the west phase of the QBO tend to be disturbed and are often connected with Major Midwinter Warmings.
If one compares the last 15 winters with the earlier years since 1958, one cannot find a convincing sign of mid-winter temperature change; but, although January 2000 was the coldest of them all, one may identify a positive temperature trend, if one starts, e.g., in 1979 (+0.7; 20%). One feature is, however, worth mentioning: the late winters from 1993 to 1996, i.e. 4 winters belonged to the group of the QBO westerlies. This did not happen before when never more than 2 consecutive winters fell into the same group. In addition, during these winters the solar activity was low, and this combination agrees with the fact that we observed cold winters, all through February. During this period of the winter the interannual variability is, as discussed above, extremely large and therefore no significant trends can be determined, see Table 1, bottom line.
Table 1: MONTHLY MEAN 30 hPa-NORTHPOLE TEMPERATURES (°C)
| YEAR | RJ | Nov | Dec | Jan | QBO | Feb | Mar | Apr | FW |
| 1951/52 | 41 | CW |
|
|
east |
|
|
|
late |
| 1952/53 | 27 | CW |
|
|
west |
|
|
|
late |
| 1953/54 | 0 |
|
|
|
west |
|
*FW |
|
early |
| 1954/55 | 23 |
|
CW |
|
east |
|
|
|
late |
| 1955/56 | 74 | -68 | -7 -79C | -76C | west | -71C | -61C | -45 | late |
| 1956/57 | 165 | -68 | -73 | -74 | east | -38* | -58 | -53C | late |
| 1957/58 | 203 | -70C | -79C | -71 | west | -49* | -61C | -57C | late |
| 1958/59 | 217 | -58CW | -67CW | -74 | east | -73C | -51*FW | -43 | early |
| 1959/60 | 146 | -71C | -69CW | -60 | west | -70C | -69C | -41 | early |
| 1960/61 | 58 | -64 | -65CW | -65 | east | -72C | -42*FW | -47 | early |
| 1961/62 | 39 | -67 | -80C | -79C | west | -67 | -65C | -57C | late |
| 1962/63 | 20 | -69CW | -74 | -74 | east | -52* | -61C | -54C | late |
| 1963/64 | 15 | -72C | -81C | -78C | west | -77C | -47*FW | -44 | early |
| 1964/65 | 18 | -70C | -77C | -76C | west | -73C | -62C | -45 | late |
| 1965/66 | 28 | -68 | -59CW | -76C | east | -60* | -56 | -48 | late |
| 1966/67 | 111 | -65 | -73CW | -80C | west | -78C | -72C | -48 | late |
| 1967/68 | 122 | -71C | -75 | -58* | west | -68 | -67C | -52C | late |
| 1968/69 | 104 | -63CW | -62 | -72 | east | -74C | -57 | -47 | late |
| 1969/70 | 112 | -71C | -73 | -49* | west | -62 | -67C | -47 | late |
| 1970/71 | 91 | -71C | -78C | -54* | east | -66 | -56 | -51C | late |
| 1971/72 | 62 | -72C | -78C | -79C | west | -70C | -56 | -44 | early |
| 1972/73 | 43 | -69CW | -79C | -73 | east | -44* | -56 | -52C | early |
| 1973/74 | 28 | -71C | -78C | -78C | west | -79C | -50*FW | -44 | early |
| 1974/75 | 19 | -65CW | -74 | -65 | east | -68 | -48*FW | -46 | early |
| 1975/76 | 8 | -71C | -77C | -80C | west | -78C | -65C | -34*FW | early |
| 1976/77 | 16 | -63CW | -68 | -60* | east | -69 | -60C | -40 | early |
| 1977/78 | 52 | -68CW | -77C | -74 | e /w | -66 | -49 | -44 | early |
| 1978/79 | 167 | -74C | -74CW | -75C | west | -60*FW | -51 | -49 | early |
| 1979/80 | 162 | -64CW | -72 | -80C | east | -70C | -46*FW | -45 | early |
| 1980/81 | 114 | -68CW | -82C | -81C | west | -56* | -54 | -54C | late |
| 1981/82 | 111 | -71C | -70CW | -71 | east | -69 | -64C | -38 | early |
| 1982/83 | 86 | -74C | -79C | -79C | west | -62 | -52 | -46 | late |
| 1983/84 | 57 | -70C | -77C | -80C | w / e | -65 | -43*FW | -50 | early |
| 1984/85 | 17 | -71C | -73 | -53* | east | -66 | -57 | -46 | late |
| [ T ] n=30 |
|
-68.6 | -74.1 | -71.5 |
|
-65.7 | -56.8 | -47.0 |
|
| sigma |
|
3.6 | 5.6 | 9.1 |
|
9.9 | 7.8 | 5.3 |
|
| C |
|
£ -70 | £ -77 | £ -75 |
|
£ -70 | £ -60 | £ -51 |
|
| 1985/86 | 3 | -73C | -81C | -76C | west | -74C | -53*FW | -41 | early |
| 1986/87 | 10 | -76C | -78C | -60* | east | -49 | -58 | -53C | late |
| 1987/88 | 59 | -66 | -56* | -77C | west | -80C | -52*FW | -44 | early |
| 1988/89 | 161 | -71C | -77C | -82C | west | -57*FW | -45 | -52C | early |
| 1989/90 | 177 | -71C | -79C | -80C | east | -63 | -66C | -52C | late |
| 1990/91 | 137 | -74C | -76 | -70 | west | -57* | -61C | -45 | early |
| 1991/92 | 150 | -72C | -78C | -66 | east | -59 | -55 | -44 | early |
| 1992/93 | 59 | -70C | -77C | -80C | west | -68 | -54 | -49 | late |
| 1993/94 | 58 | -70C | -70CW | -66 | west | -77C | -65C | -38 | early |
| 1994/95 | 24 | -71C | -81C | -70 | e /w | -57 | -66C | -49 | late |
| 1995/96 | 12 | -71C | -79C | -81C | west | -75C | -55 | -48 | late |
| 1996/97 | 7 | -66CW | -69 | -79C | east | -83C | -79C | -56C | late |
| 1997/98 | 32 | -73C | -66 | -67 | west | -64 | -62C | -48 | early |
| 1998/99 | 62 | -72C | -63* | -67 | east | -69* | -51 | -55C | late |
| 1999/00 | 90 | -75C | -81C | -84C | west | -74C | -60C | -46C | late |
| Trend | K/dec | -1.2 | -0.2 | -0.7 | - | -1.0 | -0.03 | +0.1 |
|
| conf. | % | 99 | 20 | 54 | - | 60 | 3 | 12 |
|
Spring: March is an important time of the winter, as a long lasting undisturbed cold vortex is a meteorological situation in which ozone can be destroyed, while earlier breakups of the vortex are connected with ozone transport into the Arctic. The spring of 1997 was the coldest within our series of 45 winters. One should not imply a clear trend here, as the overall trend in March in the Arctic is almost zero, Figure 1. This Figure may serve as a warning: if one uses the complete series since 1956 to calculate a linear trend, the trend is zero. If one uses the first 25 years the trend is positive and statistically significant, whereas it is negative and, again, statistically significant from 1981 to 1997. In other words, the trend depends on how one cuts the cake (Labitzke and van Loon, 1999). If one combines the temperature changes of March and April during the last 15 years, one ends up with no or a slightly positive trend for this period, although only 2 major Final Warmings took place during these years in contrast to 9 during the earlier 34 years. The timing of the Final Warmings during the last 15 years was evenly distributed. During the earlier years it happened that in 7 cases in a row the transition was late (in 1965-1971), followed by 9 years when it was early (in 1972-1980). The reason for this must be sought in the troposphere.

Fig. 1 Time series of the 30 hPa monthly mean temperatures at the North Pole in March, 1956-2000. Linear trends have been computed for three different periods. (Labitzke and van Loon 1999, updated).
The temperature trend described above for the 30 hPa level is similar for the lower stratosphere, e.g. the 50 hPa level. But if one goes about 7km higher, to the 10 hPa level where the FUB-data are available since 1965, the trend appears to change, and February is shown as an example, Figure 2. This agrees with positive temperature trends during winter reported from rocketsonde data (Chanin and Ramaswamy, 1999) and with model results which indicate only weak cooling in the middle stratosphere above a cooling in the lower stratosphere in connection with the observed ozone decrease (Langematz, 2000). But caution is recommended, as the variability is, as stressed before, very large and any trend can be derived, depending on the beginning and the end of the time series.
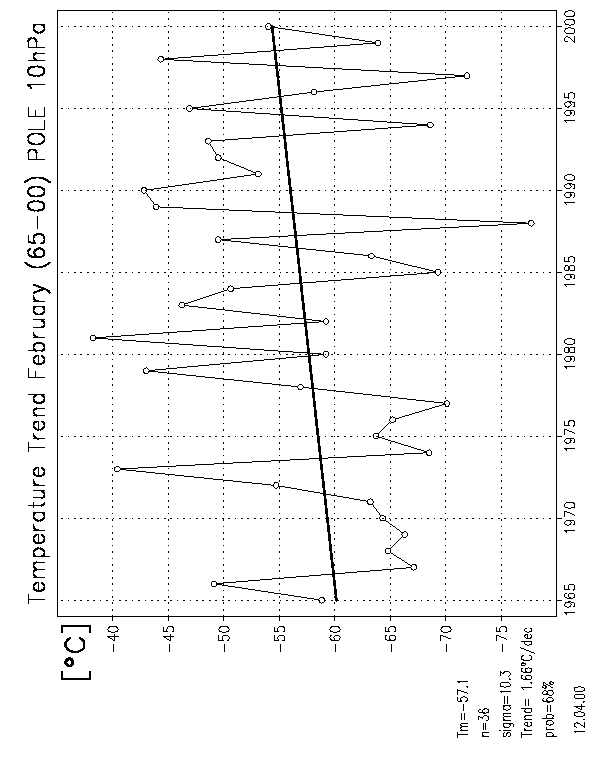
Fig. 2 Time series of the 10 hPa monthly mean temperatures at the North Pole in February, 1965-2000. The linear trend is +1.66 C/dec with a probability of 68%.
|
Classification of Stratospheric Warmings Major Midwinter Warmings occur mostly in January-February. In addition to warming of the north polar region and reversal of the meridional temperature gradient, they are also associated with a breakdown of the polar vortex, which is replaced by a high. That is, the definition of a Major Midwinter Warming requires not only the warming but also a total change of circulation. The definition of a breakdown of the polar vortex is that the usual westerlies in the Arctic at 10 hPa are replaced by easterlies so that the centre of the vortex moves south of 60-65°N. The vortex is either displaced entirely or split into two. This type of warming has not been observed in the Antarctic. Minor Warmings can indeed be intense and sometimes also reverse the temperature gradient, but they do not result in a reversal of the circulation at the 10 hPa level. They are found in the Antarctic as well. Canadian Warmings often happen in early winter. They take place when the Aleutian stratospheric high intensifies and moves poleward. The Canadian warmings can reverse the meridional temperature gradient and sometimes briefly change the zonal wind direction over the polar cap, but nevertheless they do not lead to a breakdown of the cyclonic polar vortex. Final Warmings mark the transition from the cold cyclonic vortex in winter to the warm high centred on the pole in summer. Their intensity varies much and they can be divided into major and minor Final Warmings. The time when the Final Warmings take place - when the westerlies of winter are replaced by the easterlies of summer - also varies a good deal, so they are further divided into early and late Final Warmings. Naturally, there are also Final Warmings in the Southern Hemisphere. |
Chanin, M.L. and V. Ramaswamy, 1999: Trends in stratospheric temperatures. In: Scientific Assessment of Ozone Depletion: 1998. WMO Report No. 44, Chapter 5.
Labitzke, K., 1987: Sunspots, the QBO, and the stratospheric temperatures in the north polar region. Geophys. Res. Lett., 14, 535-537.
Labitzke, K. and H. van Loon, 1999: The Stratosphere: Phenomena, History, and Relevance, 190pp. Springer, Berlin Heidelberg New York.
Langematz, U., 2000: An estimate of the impact of observed ozone losses on stratospheric temperatures. G.R.L, submitted.
Scherhag, R., 1952: Die explosionsartigen Stratosphärenerwärmungen des Spätwinters 1951/52. Berichte des deutschen Wetterdienstes in der US-Zone, 6, Nr.38, 51-63.
van Loon, H. and K. Labitzke, 2000: The influence of the 11-year solar cycle on the stratosphere below 30km: a review. Space Sci. Rev, 83, in press.
![]()