 |
Stratospheric Processes And their Role in Climate
|
||||||||
| Home | Initiatives | Organisation | Publications | Meetings | Acronyms and Abbreviations | Useful Links |
![]()
|
Stratospheric Processes And their Role in Climate
|
||||||||
| Home | Initiatives | Organisation | Publications | Meetings | Acronyms and Abbreviations | Useful Links |
![]()
The SPARC Scientific Steering Group agreed at its session in 1997 that it was important and timely to undertake a review of stratospheric aspects of climate forcing aimed at providing, for the use of the climate modelling community, the current best estimates of relevant forcing parameters. This was partly in response to the requirement identified by the Conference on the World Climate Research Programme in August 1997 to assess "the impact of natural and human-produced aerosols on the climate system", "quantifying and clarifying the impact of the major depletions of ozone in the lower stratosphere", and "examination of effects of natural external forcing, in particular solar variability". This activity would complement the efforts of the WCRP Working Group on Coupled Modelling (WGCM) in reviewing standardized forcing scenarios to be used in transient climate model simulations of the climate of the twentieth century.
The SPARC Working Group was established in early 1998. The people involved in the working group at some stage are listed in Table 1. Its objective has been to provide, to the climate modelling community, the current best estimates of appropriate parameters that determine stratospheric aspects of recent time-varying climate forcing. The approach has been to consolidate existing information and provide estimates of time-varying forcings over the period since about 1880 associated with stratospheric ozone, stratospheric volcanic aerosols and solar variations. This is a brief report on the activities of the Working Group, with the forcing data sets now available from the SPARC Data Center (http://www.sparc.sunysb.edu).
|
J. Haigh |
Imperial College, UK |
|
N. Harris |
European Ozone Research Coord. Unit, UK |
|
D. Karoly |
Monash University, Australia |
|
J. Lean |
Naval Research Laboratory, USA |
|
J. Mitchell |
Hadley Centre, UK |
|
S. Pawson |
NASA Goddard SFC, USA |
|
L. Poole |
NASA Langley Research Center, USA |
|
V. Ramaswamy |
NOAA GFDL, USA |
|
W. Randel |
NCAR, USA |
|
A. Robock |
Rutgers State Univ., USA |
|
S. Solomon |
NOAA Aeronomy Lab., USA |
|
G. Stenchikov |
Rutgers State Univ., USA |
It is clear that the changes in stratospheric ozone over the last twenty years have been an important forcing of climate change. They have led to significant changes in the temperature in the lower stratosphere and the troposphere. These changes have been reviewed recently by the SPARC Ozone Trends Assessment (Harris et al., 1998) and the WMO/UNEP Ozone Assessment (Bojkov and Hudson, 1999; Chanin and Ramaswamy, 1999).
A global stratospheric ozone trends data set, which makes use of the results from the SPARC Ozone Trends Assessment, has been prepared by Randel and Wu (1999). This provides monthly ozone profile trend estimates above the tropopause for the period 1979-97. SAGEI/II profile trends have been used above 20km outside of the polar regions, and results between the tropopause and 20km were derived by differencing SAGE and TOMS column ozone trends. In polar regions, trends have been derived from ozone sonde data up to 27km, using the near-complete records at Syowa (69°S) and Resolute (75°N). While these polar ozone sonde trends agree well with TOMS outside of polar night, the Arctic data indicate significant ozone losses beginning in midwinter that are not observable in TOMS data. This construction of the ozone profile trends is shown schematically in Figure 1, together with the zonal mean ozone trends in April and October from Randel and Wu (1999) in Figure 2. The ozone profile trends have been assessed further by Randel et al. (1999) and compared with NH midlatitude ozonesonde profiles. These monthly ozone trends are available at 1km vertical resolution and 5 degree latitude resolution, with further details at the SPARC Data Center.
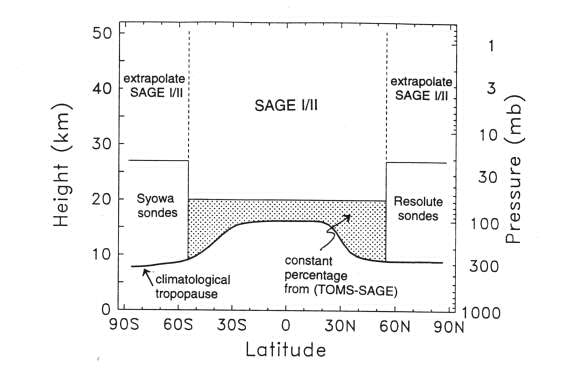
Figure 1: Schematic diagram showing the sources of data for the global ozone trend estimates of Randel and Wu (1999).
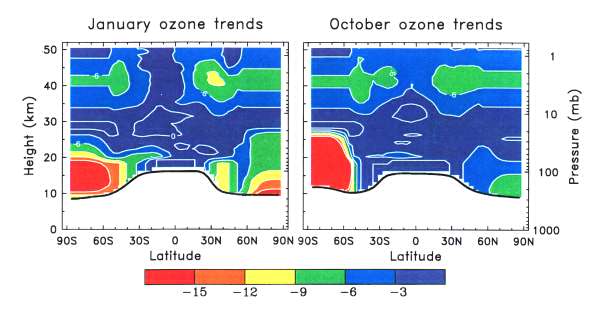
Figure 2: Global ozone trends for January (left) and October (right), shown in units of percent per decade, from Randel and Wu (1999). The local 95% statistical significance levels are trends on the order of 3-5% per decade.
In addition to the recent decreases in stratospheric ozone, there have been significant increases in tropospheric ozone over the last hundred years. While the observational network is sufficient to identify these increases, it is not adequate to describe the horizontal distribution of these changes in tropospheric ozone. Kiehl et al (1999) have used an atmospheric chemical transport model, together with satellite and ozonesonde data, to produce a hybrid monthly ozone data set from 1870 to 1990 for the troposphere and stratosphere. In the troposphere, the chemical model provides most of the information on the ozone distribution and its changes. In the stratosphere, the ozone trends are very similar to those developed by Randel and Wu (1999). For the data set available through the SPARC Data Center, the Randel and Wu ozone data set in the stratosphere have been merged with the Kiehl et al (1999) data set, to ensure consistency between the two data sets.
Major volcanic eruptions lead to increases in the stratospheric aerosol load, which affect the radiative forcing of climate through scattering and absorption of solar radiation. Direct measurements of stratospheric aerosol optical depth exist only for about the last twenty years with reasonable global coverage through satellite observations. The radiative forcing associated with historic eruptions before the satellite era is more uncertain. Sato et al. (1993) estimated aerosol optical depth from ground-based observations over the last century, and this has been used in a number of modelling studies. This estimate has been updated and adjusted recently by Andronova et al. (1999).
The eruption of Mt Pinatubo in 1991 caused the most recent major increase in volcanic aerosols. Alan Robock and Georgiy Stenchikov have produced a 2-year stratospheric aerosol data set (June 1991 - May 1993) suitable for use in forcing climate models (Stenchikov et al., 1998). This includes monthly latitude-height information on aerosol optical thickness and size distributions. This Pinatubo aerosol forcing data set has been used for simulations in a number of climate models (Andronova et al., 1999; Bengtsson et al., 1999; Kirchner et al., 1999) and is being used in the Pinatubo Simulation activity of the GCM-Reality Intercomparison Project for SPARC (GRIPS). This involves the comparison of climate model results to learn about the sensitivity of models to the forcing and the robustness of the climate response. Robock and Stenchikov can produce forcing data compatible in both spectral and spatial resolution with the climate models that will use them. Further information is available from the SPARC Data Center.
The variations of total solar irradiance associated with the 11-year sunspot cycle have been assessed with some accuracy using satellite data for more than 20 years. However, measurements of the absolute magnitude of total solar irradiance and of the magnitude of modulations of solar irradiance between solar cycles are less certain due to problems with the absolute calibration of satellite instruments and comparisons between measurements from different instruments.
The estimation of earlier solar irradiance fluctuations is indirect. Several recent reconstructions estimate variations in solar irradiance of about 0.24% to 0.30% on decadal to centennial timescales (Lean et al., 1995; Lean, 1997; Hoyt and Schatten, 1993), compared with a 0.1% modulation during the 11-year solar cycle measured from satellite. The reconstructions of Lean et al. (1995) and Hoyt and Schatten (1993), which have been used in climate modelling studies, vary not only in amplitude but also show a considerable phase lag at times. These two estimates of total solar irradiance variations are available from the SPARC Data Center.
Satellite measurements show that there are variations in the solar spectrum, particularly at short wavelengths, during the 11-year solar cycle. These variations in solar UV irradiance during the solar cycle are proportionally much larger than in total solar irradiance. They could affect the photochemistry of ozone in the stratosphere, leading to an indirect climate forcing through changes in the ozone distribution. Lean et al (1997) provides high resolution spectral estimates of solar irradiance from 120 nm to 1000 nm during solar maximum and solar minimum based on satellite measurements. These are available from the SPARC Data Center.
Recent estimates of parameters relevant to stratospheric aspects of climate forcing have been reviewed and numerical data sets collated at the SPARC Data Center. These include:
Further information about these climate forcing data is available in the relevant references below and from the SPARC Data Center.
Andronova, N. G., E. V. Rozanov, F. Yang, M. E. Schlesinger, and G. L. Stenchikov, 1999. Radiative forcing by volcanic aerosols from 1850 to 1994. J. Geophys. Res., 104, 16,807-16,826
Bengtsson, L., E. Roeckner, and M. Stendel, 1999: Why is the global warming proceeding much slower than expected? J. Geophys. Res., 104, 3,865-3,876.
Bojkov, R. D., and R. D. Hudson, 1999. Ozone variability and trends. In Scientific Assessment of Ozone Depletion: 1998. WMO Global Ozone Research and Monitoring - Report No. 44, 4.1-4.4.55.
Chanin, M.-L., and V. Ramaswamy, 1999. Trends in stratospheric temperatures. In Scientific Assessment of Ozone Depletion: 1998. WMO Global Ozone Research and Monitoring - Report No. 44, 5.1-5.59.
Harris, N., R. Hudson, and C. Phillips, 1998. SPARC/IOC/GAW Assessment of Trends in the Vertical Distribution of Ozone. SPARC Report No.1. WMO Gobal Ozone Research and Monitoring Report No. 43.
Hoyt, D. V., and K. H. Schatten, 1993: A discussion of plausible solar irradiance variations, 1700-1992. J. Geophys. Res., 98, 18,895-18,906.
Kiehl, J. T., T. L. Schneider, R. W. Portman, and S. Solomon, 1999. Climate forcing due to tropospheric and stratospheric ozone. J. Geophys. Res., in press.
Kirchner, I., G. L. Stenchikov, H.-F. Graf, A. Robock and J. C. Antuña, 1999: Climate model simulation of winter warming and summer cooling following the 1991 Mount Pinatubo volcanic eruption. J. Geophys. Res., 104, 19,039-19,055.
Lean J., J. Beer and R. Bradley, 1995: Reconstruction of solar irradiance since 1600: Implications for climate change. Geophys. Res. Lett., 22, 3195-3198.
Lean J., 1997: The Sun's variable radiation and its relevance for earth. Ann. Rev. Astrophys. 35, 33-67
Lean, J., G. J. Rottman, H. L. Kyle, T. N. Woods, J. R. Hickey, and L. C. Puga, 1997. Detection and parameterization of variations in solar mid and near ultrviolet radiation (200 to 400 nm). J. Geophys. Res., 102, 29,939-29,956.
Randel, W. J., R. S. Stolarski, D. M. Cunnold, J. A. Logan, M. J. Newchurch, J. M. Zawodny, 1999. Trends in the vertical distribution of ozone. Science, 285. 1689-1692.
Randel, W. J., and F. Wu, 1999. A stratospheric ozone trends data set for global modelling studies. Geophys. Res. Lett., in press.
Sato, M., J. E. Hansen, M. P. McCormick, and J. B. Pollack, 1993: Stratospheric aerosol optical depths, 1850-1990. J. Geophys. Res., 98, 22,987-22,994.
Stenchikov, G. L., I. Kirchner, A. Robock, H.-F. Graf, J. C. Antuña, R. Grainger, A. Lambert, and L. Thomason, 1998: Radiative forcing from the 1991 Mount Pinatubo volcanic eruption. J. Geophys. Res., 103, 13,837-13,857.
![]()