|
Stratospheric Processes And their Role in Climate
|
||||||||
| Home | Initiatives | Organisation | Publications | Meetings | Acronyms and Abbreviations | Useful Links |
![]()
|
Stratospheric Processes And their Role in Climate
|
||||||||
| Home | Initiatives | Organisation | Publications | Meetings | Acronyms and Abbreviations | Useful Links |
![]()
The stratosphere-troposphere system is changing due to both natural and anthropogenic factors, and the challenge is to understand the system sufficiently well to predict future scenarios. The test of this understanding lies in explaining past changes, but these changes need to be adequately quantified. To this end, SPARC has conducted three major assessments on temperature, ozone, and water vapour. These results have been used in the Scientific Assessment of Ozone Depletion 1999, and in the IPCC-Third Assessment Report 2001. Trends in dynamical activity would also be crucial to determine the overall climate effects of stratospheric changes.
![]()
Chair: V. Ramaswamy (USA)
ObjectivesThe objectives are to:
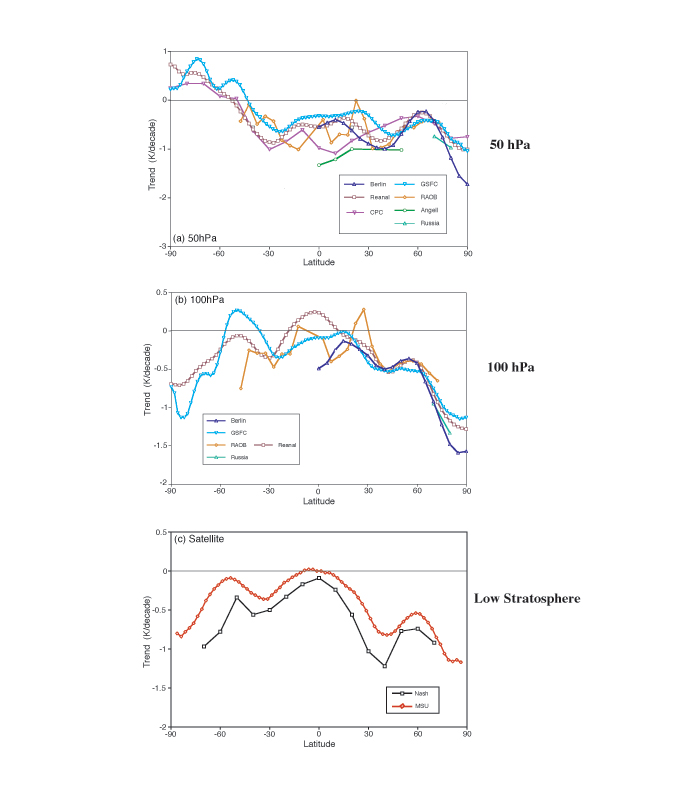
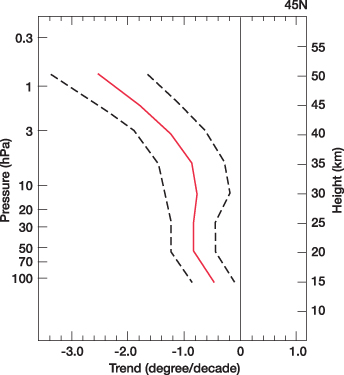
Key findingsThe first phase of the assessment has been completed (see Ramaswamy et al., Reviews of Geophysics). The results have also been reported in the recently released WMO (1999) and IPCC (2001) scientific assessments. Inter-comparison of the observations over the 1979-1994 period reveals an annual-mean cooling of the global lower stratosphere (see Figure 1), with the trends being statistically significant mainly in the midlatitudes of the Northern Hemisphere. There is a remarkable coherence amongst the various observational datasets. The global-mean, annual-mean cooling is estimated from the various datasets to be about 0.6 K/decade. Over the longer period 1966-1994, the global-mean, annual-mean cooling is estimated to be about 0.35 K/decade. Substantial cooling (~3-4 K/ decade) is observed in the lower polar stratosphere during late winter/spring in both hemispheres. However, in the Arctic, the dynamical variability is large, and this introduces difficulties in establishing a statistical significance of the trends there. The vertical profile of the annual-mean stratosphere change observed in the Northern Hemisphere midlatitudes (45°N) is quite robust among the different observations (see Figure 2). The mean trend consists of a ~0.75K/ decade cooling in the 20-35 km range, with the cooling trend increasing with height above. Model simulations indicate that changes in trace gas concentrations are major contributors to the observed cooling of the global-mean stratosphere. The trace gas changes identified are:
The cooling trend of the global stratosphere has been punctuated by transient warmings (1-2 years) following the El Chichon (1982) and Mt Pinatubo (1991) volcanic eruptions, when temporary enhancements in stratospheric aerosol concentrations induced a radiative heating. Future PlansFurther analyses of observations and model simulations will continue to advance the understanding of the variation and trends in the stratospheric thermal state. Activities planned include: Ensuring continuity, updating and consistency checks on the observed temperature time
series to the end of the last decade. The plans call for providing inputs into the next scientific assessment of stratospheric
ozone (WMO, 2002), which is already underway. |
|
|||||||
|
||||||||
|
Reference: V. Ramaswamy, M-L. Chanin, et al., Stratospheric temperature trends: Observations and model simulations, Reviews of Geophysics, 39, 71-122, 2001. |
||||||||
![]()
Chair: N. Harris (UK)
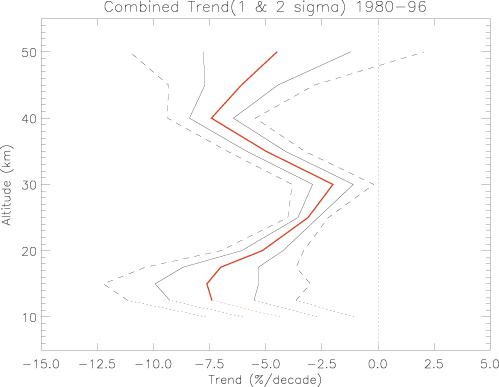
ObjectivesThe objective is to improve the understanding of the past changes in ozone. This work involves assessing the quality of existing data records and understanding past ozone trends in the light of the suggested mechanisms. AchievementsOn-going assessment of the quality of ozone measurements by ground-based and satellite instruments is coordinated by the World Meteorological Organisation’s Global Atmospheric Watch (WMO-GAW) programme. The main activity of the SPARC Ozone Trend working group has been to enhance the routine quality assessment through the organisation of the international "Assessment of Trends in the Vertical Distribution of Ozone" in conjunction with the International Ozone commission and WMO-GAW. This was published as SPARC Report N°1. The main conclusion is that the trends derived from the measurements made by a number of techniques above 20 km altitude are consistent (see Figure 3). Future PlansThere have been an increasing number of studies investigating
how decadal changes in dynamics affect the observed long-term ozone trends. Downward trends in mid-latitude ozone
have been partly caused by changes in atmospheric dynamics. Changes in regional dynamic phenomena over the last 30
years such as the Arctic Oscillation are linked with reduced ozone amounts over much of Europe. Accurate quantification
of the role of dynamics, vis a vis, that of chemical processes, remains unresolved. A new joint SPARC/IOC initiative to assess their relative importance started with a workshop in March 2001 organised in cooperation with the WMO-UNEP assessment co-chairs. In conjunction with this, continuing discussions are being held within SPARC to see how progress can be made toward a comprehensive description of past stratospheric changes. |
||||||
|
||||||
|
Reference: |
||||||
ObjectivesThe overall goal was to provide an assessment of the state of knowledge of the water vapour distribution, variability and long-term changes. Accurate knowledge of the water vapour concentration in the atmosphere and its changes is critical for understanding and predicting long-term temperature changes both at the surface and throughout the atmosphere. ActivityA large number of tropospheric and stratospheric water vapour measurements have been reported over the past 50 years. Instrumentation has evolved from in situ to satellite instrumentation but only a small number of measurements have records longer than 10 years. The objective was to gather the largest possible number of independent water vapour observations in the lower stratosphere and upper troposphere, to validate accuracy and uncertainty of the data sets, to look for consistencies between the data sets and to reach conclusions about observed changes. |
|||||
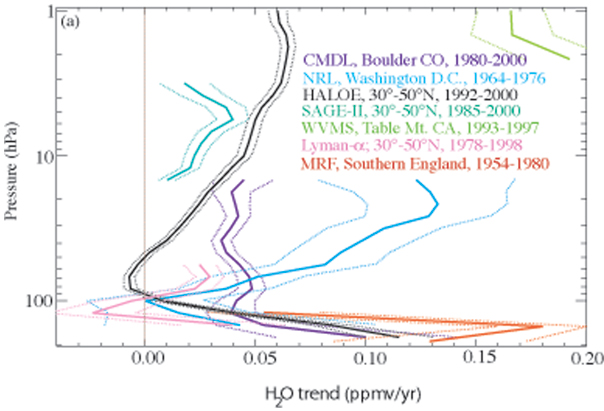
Key findingTaken together, ground-based, balloon, aircraft, and satellite measurements reveal a global stratospheric water vapour increase of ~2 parts per million by volume (ppmv) over the past 45 years or ~0.05 ppmv per year. This increase of over 75% has significant climate implications. Modeling studies by scientists from the University of Reading (UK) show that since 1980 the stratospheric water vapour increase has produced a surface temperature rise of about one half of that due to the increase of carbon dioxide alone. The reasons for this water vapour increase are unknown. One possible contributing factor is methane that has increased in the atmosphere since the 1950's, but this can only account for at most one half of the increase in stratospheric water vapour mixing ratio over this time period. Upper tropospheric humidity (UTH), i.e. ~9 to 16 km above the earth's surface, has been measured by several
consecutive generations of instruments on operational satellites. The satellite record shows a 2% increase over
the last 20 years in the equatorial region. However, the uncertainty in this determination is too large to allow a
clear conclusion as to whether this is a result of climate change. The combined uncertainty of the tropospheric
relative humidity and temperature data sets is too large to allow definite conclusions to be drawn about long-term
changes of upper tropospheric water vapour mixing ratio. Future plansSince recent publications show that the long-term change of upper tropospheric temperature and tropospheric cold-point temperature are negative, the increase of the stratospheric water vapour mixing ratio is incompatible with the simple Brewer freeze drying mechanism. The trend minimum near 100 hPa also awaits analysis and explanation. Future research is needed both in chemistry and dynamics to attempt to explain these observations. The water vapour data used in the SPARC study are available upon request at the SPARC Data Center. |
|||||
|
|||||
|
Reference: SPARC Report N°2, SPARC Assessment of Upper Tropospheric and Stratospheric Water Vapour, December 2000. |
|||||
Back to SPARC Brochure 2001 Home Page
![]()
Last update: July 04, 2001