Home Publications Courses Research
____________________________________________________________________________
![]()
Inverse Problems in Geodynamics Using
Machine Learning Algorithms
During the past few decades numerical studies have been widely employed to explore the style of circulation and mixing in the mantle of Earth and other planets. However, in geodynamical studies there are many properties from mineral physics, geochemistry and petrology in these numerical models. Machine learning (ML), as a computational statistic-related technique and a subfield of artificial intelligence (AI), has rapidly emerged recently in many fields of sciences and engineering. We focus here on the application of supervised machine learning (SML) algorithms in predictions of mantle flow processes. Specifically we emphasize on estimating mantle properties by employing machine learning techniques in solving an inverse problem. Using snapshots of numerical convection models as training samples we enable machine learning models to determine the magnitude of the spin transition-induced density anomalies that can cause flow stagnation at mid-mantle depths. Employing support vector machine (SVM) algorithms we show that SML techniques can successfully predict the magnitude of mantle density anomalies and can also be used in characterizing mantle flow patterns. The technique can be extended to more complex geodynamics problems in mantle dynamics by employing deep learning algorithms for putting constraints on properties such as viscosity, elastic parameters, and the nature of thermal and chemical anomalies.
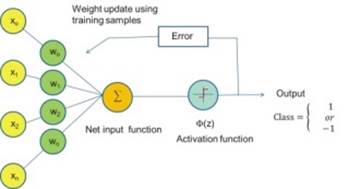
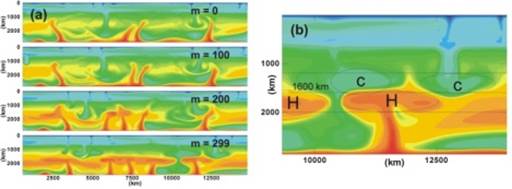
Figure 1 – Artificial neutron of McCulloch and Pitts.
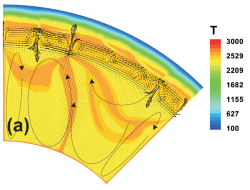
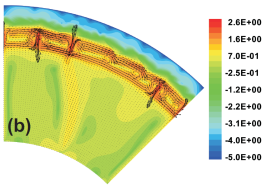
Figure 2 – a) Temperature
fields after 200 Myr evolution for the models with the density anomalies
represented by m = 0, m = 100, m = 200,
and m = 299 b) Close-up of a temperature filed showing the stagnated
slabs and plumes as described in the text.
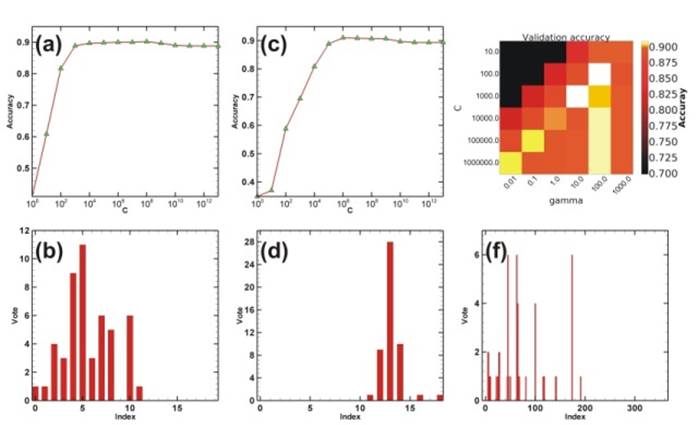
Figure 3 – Grid search results for the first inverse problem (M300 samples) a) Coarse grid search results using SVC-Linear, b) Fine grid search histogram for the model specified in (a), c) Coarse grid search results using SVC-Poly, d) Fine grid search histogram for the model specified in (c), e) Coarse grid search results using SVC-RBF, f) Fine grid search histogram for the model specified in (e).
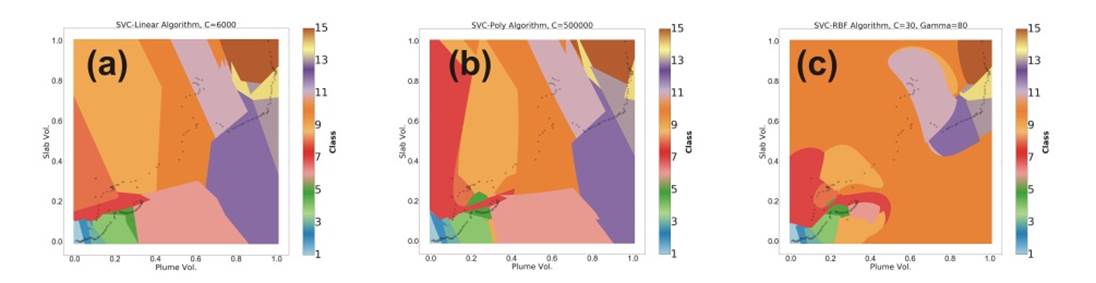
Figure 4 – Inverse problem learning models using M300 samples: a) SVC-Linear b) SVC-Poly model, c) SVC-RBF model. The training samples are shown as scattered plot (black circles). The fill-color of the circles mismatches with the background class color in the misclassified samples. The slab and plume volumes are normalized to 1. The prediction accuracies for the linear, polynomial degree 2 and RBF-kernel are about 91%, 91% and 92% respectively. For each pair of sample features, the class color identifies the class label with respect to the legend.
Alborz: A Parallelized Spherical Control Volume Convection Code (PSCVCC)
(developed by H. Shahnas)
A
Three-Dimensional Control-Volume based Model of Planetary Interior Convection
We employ a control volume methodology to develop a
new anelastically compressible model of three-dimensional thermal convection in
the "mantle" of a terrestrial planet that fully incorporates the
influence of large variations in material properties, both in radius and in
azimuth. Parallelization of the software employs the Message Passing Interface
(MPI), and the code has been ported to a Power 6 cluster and bench-marked
against an existing model which is not able to accommodate very large lateral
variations of material properties. Results for models characterized by
different Rayleigh numbers and rates of internal heating and constant physical
properties demonstrate that the control volume results are consistent with
previously published results produced by TERRA, a finite element code which
employs an icosahedral grid.
Compared with this and other formulations of the problem of high
Rayleigh number convective mixing, the control volume formulation is demonstrably
superior. The numerical model thoroughly documented herein also incorporates
the influence of solid-solid pressure-induced phase transformations, as well as
arbitrarily pressure and temperature dependent physical properties. When applied to the mantle of the Earth,
models which include the exothermic and endothermic phase transitions at 410 km
and 660 km depth respectively, and a radial viscosity profile derived from the
inversion of glacial isostatic adjustment data, exhibit similar radial layering
of the flow as previously shown to be characteristic of axi-symmetric spherical models. This
layering, an extremely important aspect of the style of convective mixing
insofar as the understanding of Earth evolution is concerned, is shown to be
relatively unaffected in the three dimensional model by the action of the
recently discovered additional pressure induced phase transformation that
occurs just above the boundary between the solid mantle and the liquid iron
outer core.
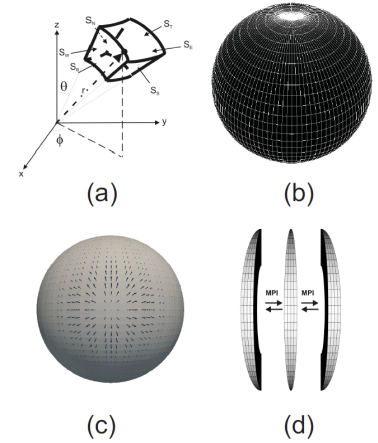
a) Spherical volume element, b) latitude-longitude grid employed, c) velocity field at a constant depth due to a Gaussian temperature anomaly at CMB which is sinusoidally vanishing at the top surface, and d) slice subdomains which communicate through the MPI.
b)
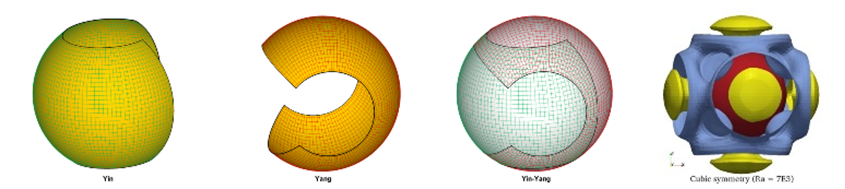
The second version of the code uses Yin-Yang grid,
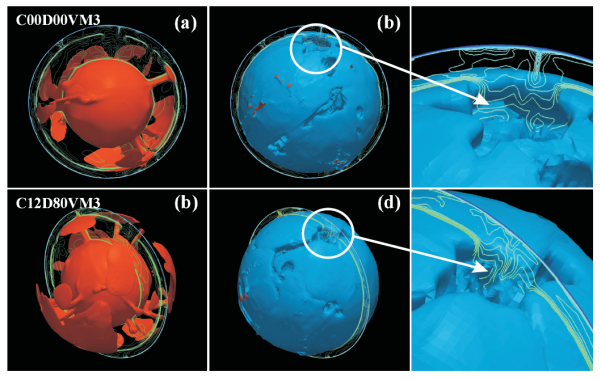
Temperature snapshots of the models C00D00VM3 and C12D00VM3. The mantle plumes stagnated at the 660 km depth phase boundary horizon, are clearly detected in both panels in the first column. The mantle avalanches are also detectable from the panels of the second column. Superimposed slices of line contours provides a better visualization of the layered convection.
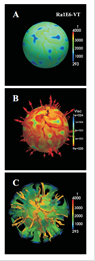
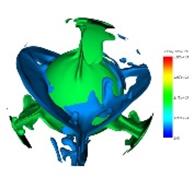
Left: A) Temperature contours at a depth
about 2370 km for the model Ra1E6-VT with
constant physical properties and depth and pressure-dependent viscosity of the
form described by equation (60-1) with
constant radial profile , B) Viscosity contours corresponding to the
temperature contours in (A) with the velocity arrows superimposed on this
surface , C) Temperature isosurfaces demonstrating the style of convection.
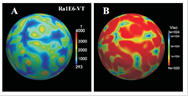
Middle: A) Temperature contours for the
model Ra1E6-VT at about 150 km depth,
B) The corresponding viscosity contours demonstrating a lateral viscosity
contrast of magnitude ~3700.
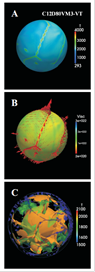
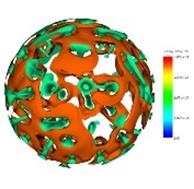
Right: A) Temperature contours at a depth about 2370 km for the model C12D00VM3 with the upper mantle exothermic and endothermic and deep mantle exothermic phase transitions and also depth and pressure-dependent viscosity of the form described by equation (60-1) with VM3 radial profile , B) Viscosity contours corresponding to the temperature contours in (A) with the velocity arrows superimposed on this surface , C) Temperature isosurfaces demonstrating the style of convection.
Animations of
Mantle Convection
Convection in a Spherical Shell with Basal and
Internal Heating:
Implications
for the Thermal State of the Thin-lithosphere Single Plate Planets
The parallelized spherical
control volume convection code (PSCVCC) is used to study the planforms
of convecting mantle and a scaling relationship between the mean mantle
temperature, the rate of internal heating and the Rayleigh number for the
planets in which there is no significant surface tectonics in three-dimensional
spherical geometry. Similarly we present a power law relation for the surface
heat flux in terms of the Rayleigh number and mean mantle temperature. In a
systematic study we employ a large number of 3D-models characterized by
different Rayleigh numbers and rates of internal heating and constant physical
properties to investigate the pattern of the convection and the thermal
characteristics of the convecting layer. Inversion of the numeric results for
the non-dimensional mean mantle temperature and surface heat flux yields to the
simple power law relations specifying the efficiency of the heat transfer in
the planet. The parameterized power law relation is then extended to a wide
range of curvatures parameter f. Compared
to the Earth-like planets in the single-plate planets with thin lithosphere
under similar conditions (the same Rayleigh number and shell curvature), the
mantle is higher in temperature due to the non-convecting lithosphere layer in
the latter case. However, due to the reduction in the vigor of near surface
convection there is a reduction in the surface heat flux in the single plate
planets.
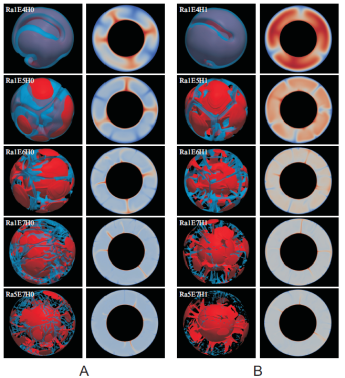
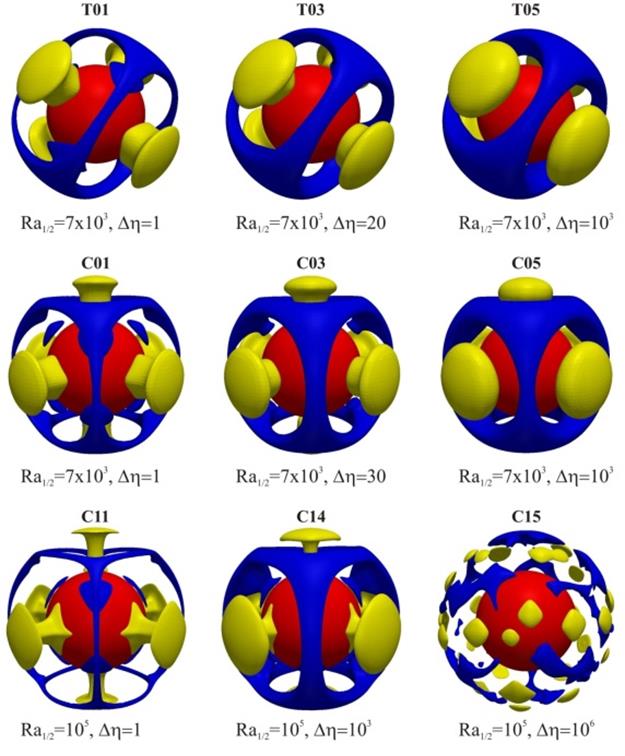
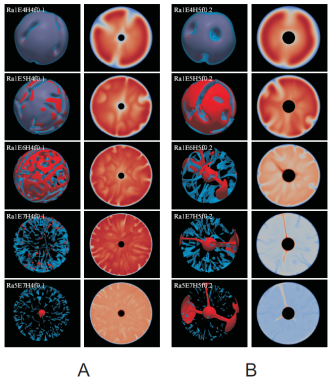
Temperature
field variation as a function of the Rayleigh number Ra and internal heating rate for Earth-like curvature (![]() ). The left panel at each
snapshot demonstrates two cold and hot isosurfaces with temperatures
). The left panel at each
snapshot demonstrates two cold and hot isosurfaces with temperatures ![]() and
and ![]() respectively where
respectively where ![]() is the mantle mean temperature. The right
panel shows a cross-section of the mantle convection. A) Snapshots for the
models with no internal heat sources, B) Snapshots for the models with non-dimensional
internal heating rate of 5.4, C) Snapshots for the models with non-dimensional
internal heating rate of 10.79, D) Snapshots for the models with non-dimensional
internal heating rate of 16.19.
is the mantle mean temperature. The right
panel shows a cross-section of the mantle convection. A) Snapshots for the
models with no internal heat sources, B) Snapshots for the models with non-dimensional
internal heating rate of 5.4, C) Snapshots for the models with non-dimensional
internal heating rate of 10.79, D) Snapshots for the models with non-dimensional
internal heating rate of 16.19.
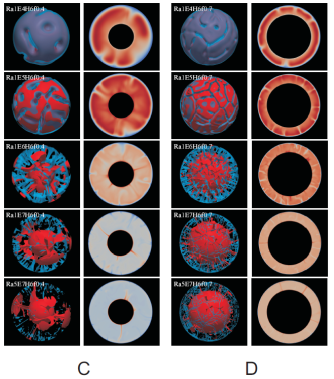
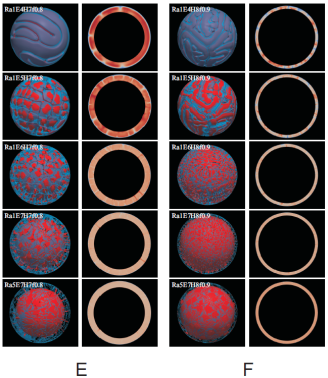
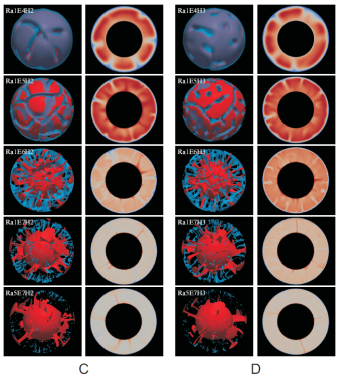
Temperature field variation as a function of the
Rayleigh number Ra and internal
heating rate for a number of models with curvature parameters between 0.1 and
0.9. The left panel at each snapshot demonstrates two
cold and hot isosurfaces with temperatures ![]() and
and ![]() respectively
where
respectively
where ![]() is the mantle mean temperature. The right
panel shows a cross-section of the mantle convection. . A) Snapshots for the
models with
is the mantle mean temperature. The right
panel shows a cross-section of the mantle convection. . A) Snapshots for the
models with ![]() and rate of internal heating of 27, B)
Snapshots for the models with
and rate of internal heating of 27, B)
Snapshots for the models with ![]() and rate of internal heating of 27, C)
Snapshots for the models with
and rate of internal heating of 27, C)
Snapshots for the models with ![]() and rate of internal heating of 16.2,
D) Snapshots for the models with
and rate of internal heating of 16.2,
D) Snapshots for the models with ![]() and rate of internal heating of 16.2,
E) Snapshots for the models with
and rate of internal heating of 16.2,
E) Snapshots for the models with ![]() and rate of internal heating of 5.4, F)
Snapshots for the models with
and rate of internal heating of 5.4, F)
Snapshots for the models with ![]() and rate of internal heating of 10.8
(the internal heating rates and temperatures are in non-dimensional form).
and rate of internal heating of 10.8
(the internal heating rates and temperatures are in non-dimensional form).
The High Pressure Electronic Spin
Transition in Iron:
Potential Impacts upon Mantle Mixing
At the Rayleigh
number appropriate to Earthfs mantle, radial heat transport is dominated by
solid state thermal convection. Because of the large number of physical
properties required to determine the Rayleigh number, and because these
properties are expected to be (perhaps strong) functions of pressure and
temperature (P-T), laboratory measurements of them under the high pressure and
temperature conditions that occur in the deep Earth are of fundamental
importance. Recent experimental data demonstrate that an electronic spin
transition in iron that occurs at midmantle depths results in significant
changes in the physical properties of the ferropericlase component of mantle
mineralogy. Additional recent results suggest that it may also exist in the
dominant perovskite component. Using control volume based numerical models we
investigate the impacts on mantle mixing of this spin transition through its
influence on the most important subset of these physical properties, namely
density, thermal expansivity, bulk modulus and heat capacity. Our numerical model
results demonstrate that this electronic transition enhances mixing in the
lower regions of the lower mantle by enhancing the vigor of rising plumes. The
lowermost region of the mantle is slightly warmed and the upper mantle slightly
cooled by spin]induced effects. However, the spin crossover in the lower
mantle appears not to significantly influence mantle layering. Due to the
competition that could exist between the strength of the spin-induced
thermodynamic properties of ferropericlase and perovskite, cold descending
thermal anomalies could stagnate at middle-to-lower mantle depths and lead to
the occurrence of ”mid mantle avalanches”.
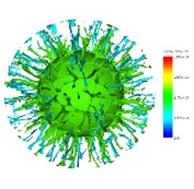
Snapshots of the spin-induced
mid-mantle avalanche (SIMMA) event in the model ![]() (CMB at 4000 K) described in section 4.4 in 10 Myr intervals.
The first and second images at each snapshot show the temperature and spin-induced anomaly of
(CMB at 4000 K) described in section 4.4 in 10 Myr intervals.
The first and second images at each snapshot show the temperature and spin-induced anomaly of ![]() form which the
laterally averaged anomalies have been subtracted at each grid point (i.e.
form which the
laterally averaged anomalies have been subtracted at each grid point (i.e. ![]() ) respectively.
) respectively.
3D
Convection and the Geometrical Effects of Curvature in the Efficiency of Heat
Transfer in an Isoviscous
Fluid
Heated from Within and Below at High Prandtl Number
Thermal
cooling models are essential in understanding the thermal history of
terrestrial planets. The thermal history of the cooling Earth have been
investigated by many authors during the last few decades (Tozer, 1967; McKenzie
& Weiss, 1975, 1980; Shrpe & Peltier, 1978, 1979; Schubert, Cassen
& Young, 1979; Turcotte, Cooke & Willeman, 1979; Davies, 1980; Peltier
& Jarvis, 1982; Richter, 1984). Cooling of the interior of terrestrial
planets and how the interior temperatures are related to surface heat flux
requires extensive study of convecting heat flow in real geometry. During the last three decades intensive
efforts have been made to understand the different aspects of heat transfer and
the effect of controlling parameters in mantle dynamics employing two
dimensional numeric models (Vangelov and Jarvis, 1994; Jarvis, 1993; Jarvis et
al., 1995). However the actual geometry of mantle convection is three
dimensional with spherical curvature at the top and bottom boundaries. During
the last decade due to improved computer and software efficiency, large 3D
numerical calculations have become possible and 3D numeric models have been
employed in the field of Earth sciences and particularly in mantle convection.
Parallel computing techniques and more efficient algorithms for large problems in
computational science have now made many numeric studies possible. Some works
have been done on Cartesian and spherical geometries. The effect of the
Rayleigh number and aspect ratio on the planform and heat transfer has been
studied by Travis et al. (1990) and Sotin and Labrosse (1999).
In
this study a systematic investigation is made to explore the effect of the
curvature on the cooling of the planets using isoviscous models heated from
within and below at infinite Pandtl number.
TERRA a 3-D spherical finite
element mantle dynamics code (Baumgardner in 1983; parallized by Bunge in 1993;
Bunge and Baumgardner, 1995) has been used.
(a) (b) (c)
Models with
different internal heating rates and Rayleigh numbers.
The Effect of
Mechanical Boundary conditions on the Secular Cooling of the Planetary Mantles
It has been suggested that the
lack of an appreciable Venusian dipolar magnetic field has resulted from the
absence of lithospheric participation in Venusian mantle convection for the
past 0.5-0.75 billion years (during this period mantle convection has been
limited to the thick stagnant-lid regime). In contrast to convection in the
stagnant-lid regime, terrestrial mantle convection (featuring the subduction of
oceanic lithosphere) is particularly efficient at cooling the Earth. Moreover,
participation of the Earth's outer thermal boundary layer in terrestrial mantle
convection carries cool material deep into the planetary interior and influences
heat flow at the core-mantle boundary. Thus, lithospheric subduction influences
the geodynamo that originates with compositional convection in the conducting
outer core.
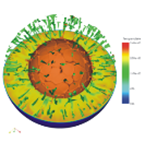
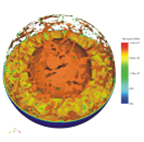
Figure 1 -Temperatures for
depth-dependent viscosity models with
free surface. Green isosurface corresponds to temperature of 1493 K and orange
surface corresponds to a temperature of 2393 K.
Figure
2 -Temperatures for depth-dependent viscosity models with rigid surface
(initially free-slip surface). Green isosurface corresponds to temperature of
1493 K and orange surface corresponds to a temperature of 2393 K. Reduction in heat
flow out of the core of up to 50% during the period that elapses between the
onset of surface immobility and the final state reached in this model which may
weaken or halt
thermal convection in the core and hence the generation of the global magnetic
field.
Layered Intra-lithospheric
Small-Scale Convection in the Ionian Asthenosphere:
Implications for Short-Range
Surface Topography and Heat Flow
Io, one of the four Galilean moons of Jupiter is
remarkable for its extensive volcanism and extremely low viscosity
asthenosphere. The implied degree of convective destabilization of the
asthenosphere is characterized by an extremely high Rayleigh number of O(1012),
suggesting vigorous thermal convection in addition to the significant internal
heat generation by tidal friction that must be transported from the interior to
the base of the Io lithosphere. This radially advected heat is evacuated to the
surface by both conduction and volcanism. Despite Io’s ubiquitous volcanism
only 4% of its mountains (montes) appear to have a volcanic origin and most of
the mountains have been initiated by tectonic processes. By employing control
volume numerical models we have investigated the style of convection in the
interior of Io and its correlation with the Ionian surface heat flux and
topography. Our control volume results support the occurrence of significant
asthenosphere heating and demonstrate that the short wavelength features of the
surface heat flux are well correlated to an expected layered intra-lithospheric
small-scale convection (LILSSC) style. These analyses suggest that the
amplitude of the short wavelength topography of Io is expected to be an order
of a few hundred meters. The model results also demonstrate that the Ionian
highs cannot be produced by a lithospheric flexure process above the hot
upwellings and therefore other tectonic events, as have previously suggested,
must be responsible for the formation of the high Ionian mountains that reach
in excess of 17 km in elevation.
(a) Snapshot of
the temperature field (K) with superimposed velocity arrows at its
statistically steady state, (b) the logarithm of the velocity field (m/yr) with
the superimposed velocity arrows.
Viscous and Impact Demagnetization of the Martian
Crust
The
magnetization of the Martian crust has been modified since the cessation of the
core dynamo at around 4 Gyr ago, partly by impact-induced shock waves at
shallow depths and partly by viscous decay at deeper parts. The thermal evolution models of Mars suggest
that the potentially magnetic layer was about
(a) (b) (c)
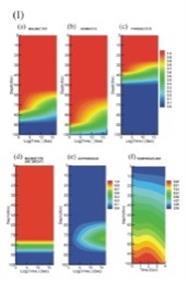
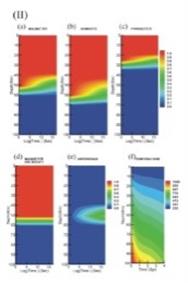
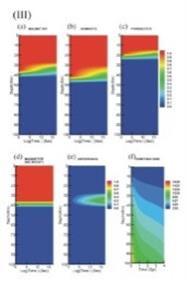
Figure
1.
The normalized magnetization (normalized
to 1 at 4 Gyr ago) of the magnetic layer as a function of time, for magnetite
(a), hematite (b) and pyrrhotite (c). Panels (d) and (e) show the thermal (with no viscous decay) and viscous
(only) demagnetization, respectively. Panel (f) shows the thermal
evolution within the upper
Anomalous topography in the western
The western
Atlantic region contains a long wavelength intraplate topography anomaly that
is defined by the NE-SW trending
A primary
edge-driven convection cell and secondary flow circulation develops at a
modeled continent-ocean plate margin and induces subsidence at the
continent-ocean margin, an offshore peak/plateau of high topography on the
ocean plate, and distal ocean plate subsidence. Unlike hot spots, the
edge-driven convection cell and associated topography migrate with moving
surface plates. The flow cell and wavelength of topography is broadened with
continent-ward motion of the lithosphere relative to the mantle, whereas a
migration in the ocean-ward direction suppresses the formation of the
edge-driven convection cell and surface topography. The wavelength of observed
anomalous topography in the western
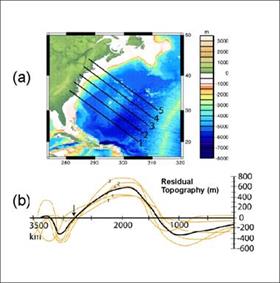
Figure 1. (a) Bathymetric map of the
western
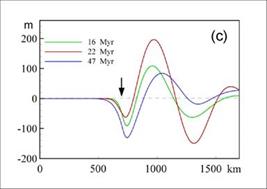
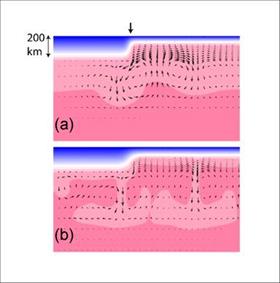
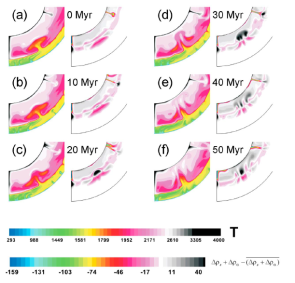
Figure 2. Temperature
fields and flow velocity vectors at (a) 22 and (b) 47 Myr. (c) Profiles of
surface topography at time intervals as indicated. Abscissa distances are from
the left side of the solution space; arrows mark the location of the
continent-ocean boundary.
On the Relative Importance of Mineral Phase
Transitions and Viscosity Stratification in
Controlling the Sinking Rates of Detached Slab
Remnants
It has been known for some time
that, in one respect, the effect on mantle convection of an endothermic phase transition of olivine at
Since the northernmost anomaly
under India/Tibet is believed to be a 141 Myr remnant of a mature subduction
zone, having ingested some
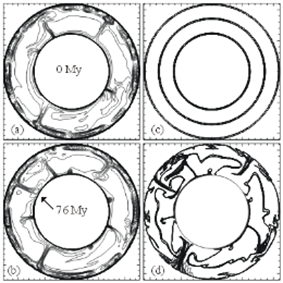
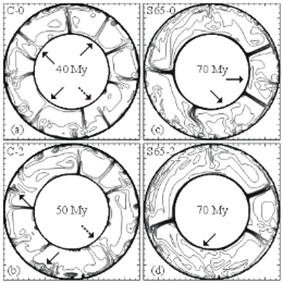
Figure 1. (a)
Isotherms at an arbitrary time, designated T = 0 Myr, in a constant viscosity
model (Model C-1) with an endothermic
phase transition at
Figure 2. (a) Isotherms of a constant viscosity model with no phase transitions , Model C-0, at the time (40 Myr) when the first cold parcels from the upper surface arrive at the CMB since T = 0. The solid arrows show the location of the arriving material; the dashed arrow indicates the location of material which arrives at t = 45 Myr. (b) Isotherms of a constant viscosity model with two phase transitions , Model C-2, at 50 Myr when the first cold parcels from the upper surface arrive at the CMB since T = 0. The dashed arrow shows the location of the arriving material. The two solid arrows indicate two sites of incipient avalanches. (c) Isotherms of a stratified viscosity model with no phase transitions , Model S65-0, at 70 Myr when the first old parcels from the upper surface arrive at the CMB since T = 0. The arrows show the location of the arriving material. (d) Isotherms of a stratified viscosity model with two phase transitions , Model S65-2, at 70 Myr when the first cold parcel from the upper surface arrives at the CMB since T = 0. The arrow shows the location of the arriving material. The contours are equally spaced over the temperature range with the steps of 67 K.
Figure 3. (a)
Stratified (step) viscosity profiles employed in depth-dependent viscosity
models. (b)Sinking times for different upper and lower mantle viscosity
contrasts in stratified viscosity models.