
Planet-Disk Interactions in Early Solar Systems
You can download a paper describing the RAPID code here in PDF format.
The brunt of my thesis focuses on the interactions between protoplanets and the gas disks in which they form during the early stages of solar system development. At this early stage of their development, the central star of a forming solar system still has a dense (but thin) disk of gas and dust orbiting it. It is from out of this gas disk that planets much like Jupiter, Saturn, and our own Earth are born.
 We don't know all the details of how a gas giant planet like Jupiter forms, but scientists believe that it starts by the slow conglomeration
of dust grains within the gas disk. These small grains are sticky---at least they stick to each other---and over hundreds of thousands of years
enough of them will stick together to form small objects maybe a few centimeters in size. It's a bit of a mystery how these pebble-sized objects accrete to
become larger objects, because by the time they are this size, they no longer stick to each other very well. However, at some point they must grow to a
size of a few kilometers. Once they are that large, scientists believe that their own gravity will cause them to start grouping loosely together as
they whiz about the disk, eventually forming a few larger objects about the size of the earth or a little bigger (see picture). And at that point
the object's gravity is strong enough to start pulling in (accreting) the surrounding gas from the disk. This last stage in the formation process happens
relatively quickly so that the few rocky cores which have been able to grow to this size, quickly start to resemble planets like Jupiter and Saturn in
both size and composition (mostly gas with small rocky cores). These few giant planets are now major players in the disk and they have a marked influence
on the subsequent evolution of the disk.
We don't know all the details of how a gas giant planet like Jupiter forms, but scientists believe that it starts by the slow conglomeration
of dust grains within the gas disk. These small grains are sticky---at least they stick to each other---and over hundreds of thousands of years
enough of them will stick together to form small objects maybe a few centimeters in size. It's a bit of a mystery how these pebble-sized objects accrete to
become larger objects, because by the time they are this size, they no longer stick to each other very well. However, at some point they must grow to a
size of a few kilometers. Once they are that large, scientists believe that their own gravity will cause them to start grouping loosely together as
they whiz about the disk, eventually forming a few larger objects about the size of the earth or a little bigger (see picture). And at that point
the object's gravity is strong enough to start pulling in (accreting) the surrounding gas from the disk. This last stage in the formation process happens
relatively quickly so that the few rocky cores which have been able to grow to this size, quickly start to resemble planets like Jupiter and Saturn in
both size and composition (mostly gas with small rocky cores). These few giant planets are now major players in the disk and they have a marked influence
on the subsequent evolution of the disk.
The stage of solar system formation where the gas giants have already formed and have become key players is the one which I study. The gas giants' substantial gravity effects spiral density waves in the disk, leading and trailing from the planets. These spiral density waves can act back on the very planet that formed them, their concerted effect able to cause the planet to migrate (usually inwards towards the central star) or to alter its eccentricity. In particular I am studying the effects of the latter couple between the planet's eccentricity and the disk structure. Many of the new planets we find have much larger eccentricities than the planets in our own solar system, and the cause of those large eccentricities is not completely understood nor is the manner by which circumstances originally differed in our own solar in order to produce less eccentric planetary orbits.
I have developed an efficient computer code which can simulate details about the evolution of such planets and disks. The code is based on a TVD (total variation diminishing) algorithm which helps to prevent spurious oscillations in the code. The core of the algorithm was originally used in cosmological simulations (Trac and Pen (2003) and Pen (1998)). I adapted the code for its present purpose in a cylindrical coordinate system. The gravity of a planet is simulated as a point source with a smoothing length of a few grid cells. The viscosity present within the code due to the effects of numerical diffusion is quite small allowing the capture of flow with Reynolds numbers on the order of 10^6.
 The image to the right shows a result from my code illustrating the formation of a gap around a planet
contained within a gas disk. The vertical axis represents the radius outward from the center of the disk
(the top of the picture is at 40% of the planet's radius the bottom is at about twice the planet's radius)
The horizontal axis is the azimuthal coordinate of the disk running from -pi (left) to pi (right) with
the planet centered in the middle. The planet itself is not shown as it is represented as a point mass in the
simulation. The colors in the picture represent the density of the disk gas, blue indicating low densities
and red representing high densities.
The image to the right shows a result from my code illustrating the formation of a gap around a planet
contained within a gas disk. The vertical axis represents the radius outward from the center of the disk
(the top of the picture is at 40% of the planet's radius the bottom is at about twice the planet's radius)
The horizontal axis is the azimuthal coordinate of the disk running from -pi (left) to pi (right) with
the planet centered in the middle. The planet itself is not shown as it is represented as a point mass in the
simulation. The colors in the picture represent the density of the disk gas, blue indicating low densities
and red representing high densities.
The red 'S' in the image is one of two spiral density waves which have formed inside and outside the planet's radius (actually on the inside of the planet's orbit only there is a third wave faintly visible). These waves transfer angular momentum from inside the planet's orbit to the outside of the disk and are responsible for the eventual clearing of gas from the gap region. The forming gap is visible as the blue pendant-like troughs extending across the image. Note that the gap is deeper on the outside of the planet's orbit than the inside. The rounded humps in these troughs (visible as a greener shade of blue) are libration islands of fluid which is temporarily trapped passing from the outside of the planet's orbit to the inside. These libration islands are important in the consideration of eccentricity excitation/damping occuring in the planet's corotation regon in order to determine the actual evolution of the planet's eccentricity.
The Euler equations which describe fluid flow in the above scenario are nonlinear, and admit few known analytical methods which can provide solutions in anything but the most simplistic situations. Numerical simulations (or 'experiments') provide an alternative; however, the numerical implementation of solution to such equations is usually not straightforward. Many instabilities, a result purely of the particular numerical method rather than any underlying physics, may be brought into a solution through such solution methods. Furthermore comparison of results from a standard problem, if complex enough, often produce varying results, even when accepted stable methods are used. These differences creep in because of a computer's finite floating point accuracy---at a given limit, even operations such as addition, cease to be distributive. As a result, differences in the hydrodynamic core of a given computer code, will yield different results. Thus, in order to be certain of the physics of a given problem, it is good strategy to make comparative tests of differing code to see the differences in behavior.
 The heart of the TVD algorithm contains a limiter scheme. This limiter scheme determines the second-order corrections to the flux
at each time step over the computational domain. Differing schemes can increase or decrease the numerical diffusion in the code. In a comparison
of different limiter schemes, all considered accurate to second order, we found substantial differences in the depth and shape of the gap that a
planet clears. An azimuthally averaged density profile is shown below for 6 different limiter schemes all taken at 384x384 resolution in the radial
and angular directions. The scheme labeled SuperBee is the least diffusive of the schemes, but it is also unstable depending on the conditions
of the gas flow. The best combination of of low diffusivity and stability of the limiters shown is the MC scheme, however, we are experimenting
with some implicitly asymmetric schemes which treat the upstream and downstream fluxes differently depending on the background flow.
The heart of the TVD algorithm contains a limiter scheme. This limiter scheme determines the second-order corrections to the flux
at each time step over the computational domain. Differing schemes can increase or decrease the numerical diffusion in the code. In a comparison
of different limiter schemes, all considered accurate to second order, we found substantial differences in the depth and shape of the gap that a
planet clears. An azimuthally averaged density profile is shown below for 6 different limiter schemes all taken at 384x384 resolution in the radial
and angular directions. The scheme labeled SuperBee is the least diffusive of the schemes, but it is also unstable depending on the conditions
of the gas flow. The best combination of of low diffusivity and stability of the limiters shown is the MC scheme, however, we are experimenting
with some implicitly asymmetric schemes which treat the upstream and downstream fluxes differently depending on the background flow.
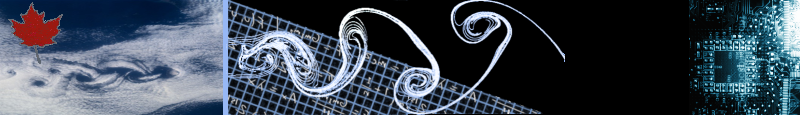
The influence of the planet's gravitational pull perturbs otherwise balanced flow of this system. Interesting fluid structures such as jets and eddies evolve in low-viscosity flows as a result of this perturbation.


These images show maps of vorticity and the "jet velocity" after 20 orbits of a planet. The first image shows the formation of eddies at an orbital radius of r=1.3. They appear as the black circles with the swirls of blue around them. Over time they begin to merge into one large vortex at the same orbital radius. The corresponding jet velocity field is also shown. The jet velocity is the "headwind" or "tailwind" felt by a particle orbiting at the balanced Keplerian speed. The blue colors represent fluid which is moving slower than the Keplerian speed and red represents fluid which is moving faster.
These jets have been linked with reduced material transport in numerous flows in the Earth's atmosphere and even in the weather systems of the Jovian planets. I am performing an analysis which aims to establish the nature of this relationship in planetary accretion disks.


The first picture shows the momentum transport time-averaged over 10 orbits measured as an effective alpha-parameter. Eddies at the L_4 and L_5 points display their characteristic quadrupole patterns (at r/a = 1. and theta/pi = +1/3 and -1/3). The second picture shows results after averaging in azimuth as well. Correlations in the velocities produce effective transport in the vicinity of the planet. Further away, transport due to the sprial density waves is apparent.

Momentum transport in the vicinity of two planets. There is a relatively high-density region between the planet corresponding to lowered transport.