Experimental Generation of Internal Gravity Waves
During my undergraduate career at the University of Alberta I was fortunate to be able to work with Professor B.R. Sutherland. His work focuses on comparing experimental and numerical methods in flows complex enough that analytic theory is unreliable. In particular he is interested in examining the interactions of internal gravity waves with other types of flows. During my last term I conducted research into the generation of internal gravity waves. The waves were produced using sinusoidal topography and as such are representative of the type of air flow produced when wind blows over mountains. Subsequent experiments involving similar setups, with flow over various types of rough topography can be found in papers on his webpage.
Internal gravity waves are waves which, like surface waves, propagates due to buoyancy forces. However, where as surface waves are confined to the surface of the fluid, internal gravity waves are able to propagate vertically through the fluid. They exist in stratified environments (fluids in which the mean density changes with height) and are able to transport energy and momentum making them an important factor in the determination of temperature and other variables. Because they exist in stratified environments, vertically propagating waves (launched from flow of air over mountain, say) grow in wave energy as they move upwards in order to conserve momentum with respect to the decreasing background mean density. As the waves become large enough, non-linear effects set in causing the waves 'break' and deposit their momentum into the mean flow. This deposition of momentum can be important. In the equatorial stratosphere, for example, deposited momentum from internal gravity waves is a major contribution in driving in the Quasi Biennial Oscillation.
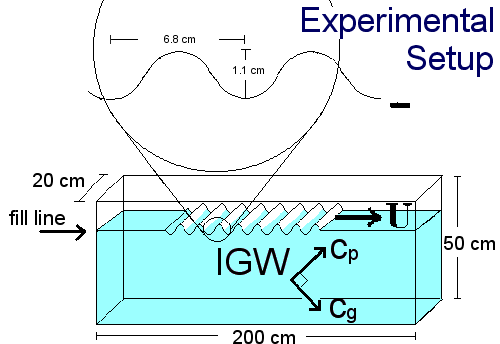 The experimental setup used for the experiment is illustrated in the schematic. A plexi-glass tank of dimensions shown was filled to the
30 cm mark. The piece used to simulate mountains was constructed of lightweight wood with a fiberglass covering. It was designed so
that its width was just shy of the 20 cm width of the tank. At the onset of the experiment, the "mountains" are quickly brought up to a
constant speed U with a non-intrusive pulley system. The movement of the topography across the fluid at speed U is equivalent to a system
where the fluid flows over stationary topography with the same speed U but in the opposite direction. The passing of the topography produces
internal gravity waves which propagate downwards away from the topography and in the direction of its motion. This propagation is
characterized by a group velocity in the direction illustrated and a phase velocity in the perpendicular direction.
Data was collected using a technique called 'Synthetic Schlieren.' Unlike a number of methods used in Fluid Dynamics to gather data, the Synthetic Schlieren method is capable of providing quantitative information on the flow. The method measures differences in the refractive index of the fluid caused by any density perturbations. In this technique a strong light source is placed behind some sort of grid/mask (a vertically space series of narrow horizontal black lines will do). In the absence of waves, light that passes through the mask is refracted as it passes through the tank, acting as a reference state. As waves move through the tank, density perturbations result, and depending whether these perturbations are lesser or greater than the background value, the light will refract less or more on its path through the tank. Now a snapshot of this perturbed state may be compared to the unperturbed one. When analyzed in detail this comparison admits information on the properties of the waves.
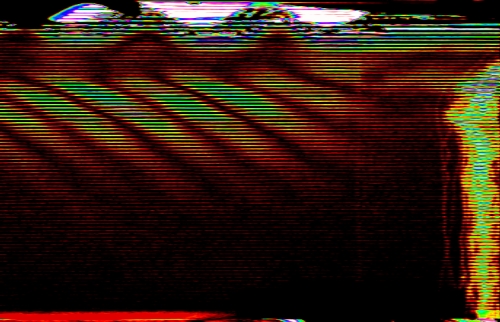 This image shows a direct digital comparison, produced by directly subtracting the difference between two frames. The first was taken about halfway through
the experiment and the second is the initial reference image. Redder colors represent perturbations to the buoyancy frequency (a measure of the density
perturbations) smaller than the background, bluer colors represent perturbations which are larger than the background. The difference has been magnified
slightly in order to bring out the contrast. One can see a clear wave train about 1/3 of the way down from the top of the image. These waves (crests in
blue/purple) are moving from left to right and from top to bottom. The mess at the top of the image is caused by the movement of the topography and the
vertical streak on the side by a dye line. The dye line is used as it allows the background flow to be calculated.
One of the most efficient ways of collecting and presenting the information obtainable from synthetic schlieren is through a time series. A vertical time series is constructed by choosing a particular vertical "slice" from a animation of wave motion. The vertical slices are then 'stacked' next to each other from left to right. Analogously, a horizontal time series is constructed by choosing a horizontal slice and stacking them from top to bottom.
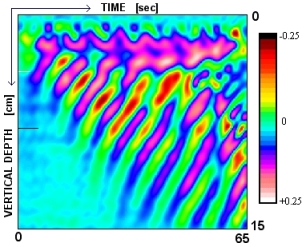
Time Series of Buoyancy Frequency
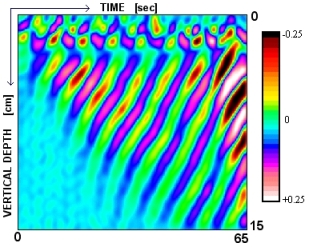
Time Series of Buoyancy Frequency Derivative
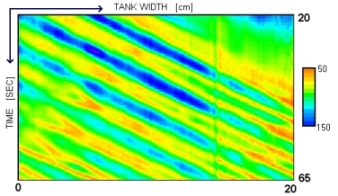
The above images shows a vertical time series collected from the experiment, and the numerical derivative of that same time series. The amplitude of the perturbations to the buoyancy frequency range as shown on the color scale on the left. The passage of the waves can be seen in this series by following the peaks or troughs as they travel from the top of the tank to the bottom as time increases. This is the direction of the group velocity.
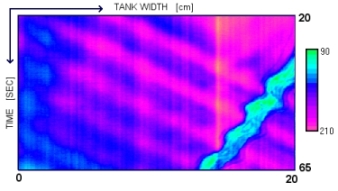
The images below shows horizontal time series taken at two different heights in the tank. By measuring the width between successive wave crests we can calculate two different values for the horizontal wave number. By measuring the time between successive crest we can calculate the angular frequency. The second time series, also shows the motion of the dye line in the lower right corner. The slope of this line provides a measure of the background flow speed. Notice that there are periodic perturbations to the background flow. These perturbations can also be measured to obtain useful information.
Horizontal Time Series
Horizontal Time Series with Dye Line
The above experiments can be analyzed by treating the fluid flow with the 2D Boussinesq approximation. Flow is separated into a background component (with height-dependent density and pressure) and a superimposed oscillatory (wave) solution. All wave solutions are assumed to have complex exponential form:

for any solution variable, X, in terms of the respective horizontal and vertical wave numbers, k and m, and the wave frequency omega, = Uk (U is the background flow speed). Internal gravity waves have a dispersion relation given as

where k^2/(k^2+m^2) is the angle of propagation of the wave train. The last relations we require are definitions for the background buoyancy frequency and the perturbations of the buoyancy frequency:

Measuring the distance between successive wave crests using our various time series allows us to calculate the buoyancy frequency, wave frequency,
vertical wave number, and two values for the horizontal wave number (one from each horizontal time series). We find:

We can see that the values for the angle, although not within error, are approximately equal. Also listed are three calculable values for the horizontal wavelength of the waves produced. Theoretically these should be equal or less than the horizontal wavelength of the topography which was measured as 6.8cm. Three different calculations for 'xi', the amplitude of the vertical motion oscillations are also possible. These different values are based alternatively on the oscillation amplitude of the buoyancy frequency, its derivative and the perturbations to the background flow
.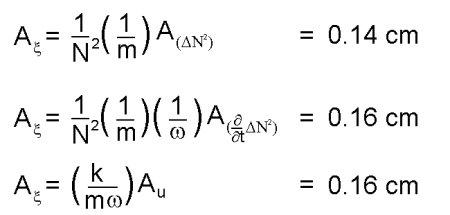
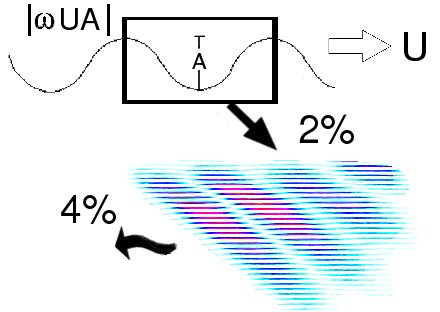
Again these show reasonable agreement to each other. They are, however, substantially less than the theoretical prediction based on the height of the topography which was measured to be 0.55cm. The discrepancy between the measured height of the topography and the calculated value for the 'xi' oscillations can be explained by considering the boundary l ayer which forms. The flow of fluid over the topography will be qualitatively different close to the topography. This layer of different flow alters the effective height of the topography. This is illustrative in the schematic below:

Two further important quantities can be calculated. The momentum flux associated with the waves and their induced mean flow are given as:

The first value can be compared to the momentum contained in topography, which is loosely thought of as the momentum associated with the marked area, A in the image below. The second value is compared to the wave's group velocity. These comparisons show that 2% of the momentum associated with the mountains is transferred into the wave motion and 4% of the wave's groups velocity is imparted to the surrounding fluid.
Using the experimental setup and the Synthetic Schlieren technique we found that it was possible to obtain reasonable quantitative information about the waves. Our results confirmed what we expected to find and our assumption that we were in the linear regime. These results were used as a calibration for the purpose of performing more complicated experiments.

