 |
Stratospheric Processes And their Role in Climate
|
||||||||
| Home | Initiatives | Organisation | Publications | Meetings | Acronyms and Abbreviations | Useful Links |
![]()
|
Stratospheric Processes And their Role in Climate
|
||||||||
| Home | Initiatives | Organisation | Publications | Meetings | Acronyms and Abbreviations | Useful Links |
![]()
Ozonesondes are small, light weight, balloon-borne instruments capable of making measurements from the surface to near 35 km in altitude. All of the ozonesonde data discussed in this report is from instrumentation using the reaction of ozone with potassium iodide in an aqueous solution as the method of detection. Three basic types of ozonesondes were used to obtain data for this assessment. These three sonde types are, however, used by a number of individual sounding programs. In practice there are important differences in the way the individual programs use an instrument of a given type. In this section of the chapter we will characterise each sonde type and will also provide relevant information from the individual programs that has a bearing on the final data product. The three sonde types considered here are the Brewer-Mast (BM), the electrochemical concentration cell (ECC), and the Japanese ozonesonde (KC).
Principle of Operation
The ozonesonde consists of a pump and ozone sensing cell coupled to a standard meteorological radiosonde through an electronics interface. The information from the ozonesonde is telemetered to the ground through the radiosonde transmitter. The parameters normally measured are the ozone concentration, ambient air pressure, temperature, humidity, and, in some cases, the wind direction and speed. Each sounding is made with an individual disposable instrument. The aqueous chemical sensing element is based on the redox reaction:
![]() 1.8.1
1.8.1
The method of detecting the free iodine, I2, is an important characteristic of the three types of electrochemical cells considered in this report. Ambient air is continuously forced into the sensing cell by a battery driven sampling pump. An electrical current is generated proportional to the mass flow rate of ozone through the cell. By knowing the volume flow rate and temperature, the electrical current can be converted to an ozone concentration under the assumption that the ozone reaction with potassium iodide is quantitatively known.
Brewer-Mast Ozonesonde
The Brewer-Mast sonde evolved from the Oxford-Kew ozonesonde developed by Brewer and Milford (1960). The Brewer-Milford type ozone sensor consists of a single electrochemical cell with a silver anode and platinum cathode immersed in an alkaline potassium iodide solution. A polarising potential of 0.42 V is applied between the electrodes such that no current will flow unless free iodine is present. In operation, ozone in the sampled ambient air is forced through the sensing solution in the electrochemical cell (bubbler) to produce free iodine according to redox reaction (1.8.1). Transported by the stirring action of the bubbler, the iodine in contact with the platinum cathode is converted back to iodide ions by the uptake of two electrons per molecule of iodine.
![]() [cathode reaction] 1.8.2
[cathode reaction] 1.8.2
Correspondingly at the anode two electrons are released through the ionisation of two silver atoms
![]() [anode reaction] 1.8.3
[anode reaction] 1.8.3
to form nearly insoluble silver iodide, which prevents iodine from entering the solution. In principle, each ozone molecule entering the sensor causes a current of two electrons to flow through the external circuit. The reaction chamber (bubbler) is made of Plexiglas and contains a cylindrical platinum mesh cathode (~6 cm2) and a thin silver wire as anode. The bubbler is filled with 2 ml of neutrally buffered aqueous solution of potassium iodide (0.1%). The electrically driven gas sampling pump is mounted at the side of the bubbler and forces about 220 sccm/min. of ambient air through the bubbler. The sonde is protected by a Styrofoam flight box. The Brewer-Mast sondes were manufactured by the Mast Keystone Corporation (Reno, Nevada, USA) and its predecessor the Mast Development Corporation.
ECC Ozonesonde
The ECC ozonesonde was developed by Komhyr (1969, 1971). The ECC ozone sensor is an electrochemical cell consisting of two half cells, made of Teflon, which serve as cathode and anode chamber, respectively. Both half cells contain a platinum mesh serving as electrodes. They are immersed in KI solution of different concentrations. The two chambers are linked together by an ion bridge in order to provide an ion pathway and to prevent mixing of the cathode and anode electrolytes.
The ECC does not require an external electrical potential. This is in contrast to the Brewer-Milford type of electrochemical ozone sensor (Brewer and Milford, 1960). The ECC gets its driving electromotive force from the difference in the concentration of the KI solution in the cathode and anode chamber, 0.06 Mol/l (1%KI) and "8.0 Mol/l (saturated KI) respectively. A non-reactive gas sampling pump (Komhyr, 1967), made of Teflon, forces ozone (flow ~220 sccm/min.) in ambient air through the cathode cell with the lower concentration of KI solution causing an increase of free iodine (I2) according to the redox reaction (1.8.1). At the surface of the Pt cathode, I2 will be converted to I- through the uptake of two electrons (1.8.2), while at the anode surface, I- is converted to I2 through the release of two electrons, such that the overall cell reaction is
![]() 1.8.4
1.8.4
Thus one ozone molecule causes two electrons to flow in the external circuit. This electrical current is directly related to the uptake rate of ozone in the cathode chamber. The sonde is flown in a polystyrene protective box. Five different models of the ECC type have been used: the SPC 3A, 4A, 5A, 6A models manufactured by Science Pump Corporation (Camden, New Jersey, USA) and the 1Z model manufactured by EN-SCI Corporation (Boulder, Colorado, USA).
Japanese Ozonesonde: KC-68 and RSII-KC79
This ozonesonde type is based on a modified version of the carbon-iodine ozone sensor (Komhyr, 1969). The ozone sensor is an electrochemical cell containing a platinum gauze as cathode and an activated carbon anode immersed in an aqueous neutral potassium iodide/potassium bromide solution. Ozone in ambient air is forced through the sensing solution generating free iodine molecules (I2) according to redox reaction (1.8.1). At the Pt cathode the iodine is reconverted into iodide/bromide by the uptake of two electrons, while correspondingly at the activated carbon anode under the release of two electrons the following reaction takes place:
![]() 1.8.5
1.8.5
One ozone molecule produces an electrical current of two electrons in the external circuit. The gas sampling pump and the electrochemical cell are made of methacrylate resin. The pump flow rate is about 400 sccm/min. The sonde is flown in a Styrofoam flight box. The RSII-KC70 is manufactured by Meisei Electric Company, Ibaraki, Japan.
Ozonesonde observations are carried out by a number of different operating agencies with varying sampling protocols, covering a variety of observational periods. Most of the locations have observations up through the 1996 period covered by the assessment and have done soundings for 10 years or more. Information on location, period of observation, operating agency, ozonesonde type, radiosonde type, frequency of observations, and altitude resolution is summarised in Table 1.13. The stations are grouped geographically and by operating agency. Several factors that deal with the processing algorithm discussed in the next section are also included in the table.
At four Canadian sites with long records, the type of ozonesonde was changed in 1980 from the BM to the ECC. At present the discontinuity (primarily in the troposphere) introduced by this change has not been satisfactorily characterised from an instrumental (as opposed to statistical) point of view. The difference in the troposphere in the sensitivity to ozone between the BM and ECC sondes is discussed further in Chapter 2 in conjunction with intercomparison results.
The standard practice is a program of weekly balloon launches. Since soundings are occasionally missed or the instrument fails, the actual number of profiles is somewhat less. During portions of the record at most of the sites there are only scattered soundings because of a reduced or intermittent schedule of launches. The three European sites (Uccle, Hohenpeissenberg, and Payerne) have carried out a more ambitious sounding program with 2-3 launches per week over a period of 20 years or more. All but a few of the sites have major gaps in their record, which range from a few months to more than a year.
Table 1.13 Station and Sounding Program Characteristics
|
|
||||||||||||
|
|
|
|
|
|
|
|
|
|
||||
|
|
|
|
|
|
|
|
|
|
|
|
|
|
|
|
||||||||||||
| 74.72° N | 94.98° W |
|
Jan. 1966-Nov. 1979 | AES/Canada | 1/week (12Z) | Mandatory and significant levels | VIZ | Yes (avg. corr. when none) | Standard | None | Constant | |
|
|
Dec. 1979-present | AES/Canada | 1/week (12Z) | VIZ 1979-93 Vaisala 1994- | Yes (data on B-P scale) |
Komhyr (1986) Komhyr (1995) |
Declining | Measured box | ||||
|
|
||||||||||||
| 58.75° N | 94.07° W |
|
Oct. 1973-Sept. 1979 | AES/Canada | 1/week (12Z) | Mandatory and significant levels | VIZ | Yes (avg. corr. when none) | Standard | None | Constant | |
|
|
Sept. 1979-present | AES/Canada | 1/week (12Z) | VIZ 1979-93 Vaisala 1994- | Yes (data on B-P scale) |
Komhyr (1986) Komhyr (1995) |
Declining | Measured box | ||||
|
|
||||||||||||
| 53.55° N | 114.10° W |
|
Oct. 1970-Aug. 1979 | AES/Canada | 1/week (12Z) | Mandatory and significant levels | VIZ | Yes (avg. corr. when none) | Standard | None | Constant | |
|
|
May 1978-present | AES/Canada | 1/week (12Z) | VIZ 1979-93 Vaisala 1994- | Yes (data on B-P scale) |
Komhyr (1986) Komhyr (1995) |
Declining | Measured box | ||||
|
|
||||||||||||
| 53.32° N | 60.30° W |
|
June 1969-Aug. 1980 | AES/Canada | 1/week (12Z) | Mandatory and significant levels | VIZ | Yes (avg. corr. when none) | Standard | None | Constant | |
|
|
Sept. 1980-present | AES/Canada | 1/week (12Z) | VIZ 1979-93 Vaisala 1994- | Yes (data on B-P scale) |
Komhyr (1986) Komhyr (1995) |
Declining | Measured box | ||||
|
|
||||||||||||
| 50.80° N | 4.35° E |
|
Nov. 1966-present Occasional breaks Little data Feb. 1983-Jan 1985 | Belgium Meteorological Institute | 3/week (10Z) |
Mandatory and significant levels | VIZ to 1990-Vaisala 1990- | Yes (all data on B-P scale | Standard to 1989 From 1989 based on measured | None |
Average from measured. Measured from 1990 |
|
|
|
||||||||||||
| 47.80° N | 11.02° E |
|
Nov. 1966-present | German Weather Service |
2/week Nov.-April 3/week |
Mandatory and significant levels | VIZ with hypsometer Vaisala from 1994 | Yes (after 1968) |
Standard | None | Constant | |
|
|
||||||||||||
| 46.82° N | 6.95° E |
|
Nov. 1966-present | Swiss Meteorological Institute | 3/week (11Z) |
Fixed pressure levels (~.25 km) | VIZ to 1980 Swiss (2 types) | Yes (to Arosa total) | Standard | None | Constant | |
|
|
||||||||||||
| 43.93° N | 5.70° E |
|
1989-present | 1/week | Vaisala/TMZX | Yes | Constant | Measured | ||||
|
|
||||||||||||
| 40.03° N | 105.07° W |
|
March 1979-present. Missing Jan. 1990- June 1991 |
NOAA/CMDL | 1/month to 1985 1/week 1985- |
0.25 km | Vaisala/TMAX | Yes ( data on B-P scale) |
Average (Johnson, 1997) 1991 meas. |
Constant | Measured box to 1990. Measured pump 1991- | |
|
|
||||||||||||
| 19.72° N | 155.07° W |
|
Sept. 1982-present | NOAA/CMDL | 1/week | 0.25 km | Vaisala/TMAX | Yes (all data on B-P scale) |
Average (Johnson, 1997) 1991 meas. | Declining | Measured box to June 1991 Measured pump July 1991- | |
|
|
||||||||||||
| 43.05° N | 141.33° E |
|
Dec. 1968-present | Japan Meteorological Agency | Japanese | Yes | Standard | Declining | Measured box | |||
|
|
||||||||||||
| 36.05° N | 140.10° E |
|
Jan. 1968-present | Japan Meteorological Agency | Japanese | Yes | Standard | Declining | Measured box | |||
|
|
||||||||||||
| 31.55° N | 130.55° E |
|
May 1968-present | Japan Meteorological Agency | Japanese | Yes | Standard | Declining | Measured box | |||
|
|
||||||||||||
| 37.93° N | 75.48° W |
|
July 1969-present | NASA/WFF | 2/month | Mandatory and significant levels | VIZ to 1995 VIZ digital 1995- |
WOUDC data renormalized to B-P scale |
Measured (Torres, 1981) |
Constant | Measured box | |
|
|
||||||||||||
| 45.03° S | 169.68° E |
|
Aug. 1986-present | NIWA | 1/week Aug-Nov 2/week |
0.10 km | VIZ to 1990 Vaisala/TMAX 1990- | No | (Johnson, 1997) average | Declining to 1990 | Measured box | |
All three of the ozonesonde types use the following equation to
convert the sensor output (current) into the partial pressure
of ozone (![]() ) in millipascals:
) in millipascals:
![]() 1.8.6
1.8.6
where t is the time in seconds to pump 100 ml of air at a temperature T (in K), i is the output current (in microamperes) and ib is the background current (the output with ozone free air flowing through the sensor). This equation is valid if no ozone is destroyed in the air sampling system, each ozone molecule produces two iodine molecules, and there are no interfering reactions in the solution from minor constituents other than ozone in the air sample.
Three primary types of factors may influence the determination of an ozone profile and each of these types can lead to changes in instrument performance that may vary with time and potentially introduce a bias into the measurement time series. These three types include algorithmic factors, operating procedures and instrument manufacture, and environmental conditions. In some cases these factors may fall into more than one category, but are treated here under a single factor.
1.8.4.1. Algorithmic Factors
These factors deal primarily with the computation of the ozone profile from the measured sensor output and include: 1) The determination of the correction for loss of pumping efficiency at reduced atmospheric pressure; 2) Subtraction of the ''background'' signal (reading for zero ozone) from each reading; 3) Application of the pump temperature; 4) Response time of the sensor; and 5) ''Normalisation'' of the integrated profile amount to an independently measured total column ozone amount.
Pump Efficiency Correction
The standard procedure is to use an average pump efficiency correction for each type of instrument. This correction is usually determined at the time of development of the instrument and not periodically checked. Recent tests on the BM sonde (DeBacker et al., 1998) show that the correction is significantly larger above 20 km than previously determined. The pump efficiency has also probably deteriorated over time as a result of changes in manufacturing practices (DeBacker et al., 1998). If the pump efficiency changes with time but the correction remains unchanged (the usual case to this point) the profile may be affected not only at the altitudes where this correction is significant (>25 km), but also at other altitudes as well because of the procedure of correction to the independently measured total ozone amount. At Uccle corrections have been applied for likely changes in pump performance.
For the ECC sonde the correction for the loss of air pump efficiency is done according to the data in Komhyr (1986) or Komhyr et al. (1995). The latter is adopted by the Vaisala (a large provider of ECC sondes) manual and gives about 3% more ozone at 5 hPa and 1% more at 10 hPa than Komhyr (1986). Recent determinations of the ECC pump efficiency correction suggest that previous measurements underestimated the actual efficiency loss (Johnson et al., 1998). It does not appear that there have been large changes over time in the performance of the ECC pumps. In 1995 the Canadian stations changed the correction, but this was a small change that likely has not affected the record.
The Japanese ozonesonde has used the same pump and average corrections over the period of measurements. The pump efficiency correction measurements for the various sondes are summarised in Table 1.14.
|
hPa |
standard |
BM measured |
|
Torres 1981 |
Komhyr 1986 |
ECC Komhyr et al. 1995 |
|
measured at Uccle |
|
|
|
|
|
|
|
|
|
|
|
|
|
|
|
|
|
|
|
|
|
|
|
|
|
|
|
|
|
|
|
|
|
|
|
|
|
|
|
|
|
|
|
|
|
|
|
|
|
|
|
|
|
|
|
|
|
|
||
|
|
|
|
|
|
|
Table 1.14. Correction for Efficiency Loss in the Ozonesonde Pump
Background Current Measurements
Measurement of the ozonesonde signal when no ozone is present is not routinely done for BM sondes, where this signal is assumed to be zero except at Payerne, where in recent years this is checked but is not applied as part of the processing.
For the ECC and Japanese sondes the background current is measured for each sounding prior to the balloon launch. At all stations except the NOAA/Climate Modelling and Diagnostics Laboratory (CMDL) stations and Lauder, this offset gradually declines with the decreasing pressure and becomes insignificant in the stratosphere. The method of removal of the background signal is of some importance in the troposphere especially in the tropics where this signal can be a significant fraction of the measured ozone signal. The application of this offset primarily affects trends when the procedure changes. The one station where this is likely to have occurred is Hilo, Hawaii, where a correction procedure has been implemented.
Pump/Box Temperature Measurement
In order to correct for changes in the air volume flow due to temperature changes (eq. 1.8.6), the temperature at the pump or in the instrument enclosure (box) should be measured. The practice for the BM sondes is to assume that the pump temperature is constant. Only at Uccle is it measured, and the temperature is found to decline by 15-20°C over the course of the flight, which leads to a 5% error in ozone computation for the highest altitudes.
In the ECC and Japanese sondes either the box or pump temperature is measured. There is normally about a 2-5°C difference (pump warmer in most configurations) at the top of the flight. Several of the ECC stations have changed from a box to a pump temperature measurement, but the change is likely not significant.
Sensor Response Time
For the ECC sonde (the other types are similar) the time for a 90% response to a step change is approximately 50 s. This translates into a height resolution of about 150 m and a slight displacement of the profile in the vertical relative to a measurement made with a faster responding sensor such as a UV photometer. The usual practice is to make no correction for the lag in response. At Uccle, where both ascent and descent profiles are measured, a deconvolution that accounts for the response is used so that the ascent data can be compared with the descent data, which is obtained from the rapidly descending instrument after balloon burst.
Normalisation to Measured Total Ozone
Most of the stations making ozonesonde measurements over a long period of time adjust the integrated ozone amount from the profile to an independently measured column amount. This procedure requires a homogeneous total ozone data set and a consistent method for estimating the ozone amount above the profile ceiling level (which is usually between 15-7 hPa). The total ozone scale for the Dobson spectrophotometer was adjusted in 1992 to account for a re-determination of the ozone cross-section. This requires a reduction of ozone amounts by 2.6% (data scaled by 0.9743). Reprocessed data for Hohenpeissenberg, Uccle, the NOAA/CMDL sites, and Japanese stations have applied this correction. The Canadian stations, which use the Brewer spectrometer for total ozone, were already using the Bass-Paur scale for the ECC series. The BM data were adjusted to the Bass-Paur scale for this report. For Wallops Island data, a homogeneous total ozone data set was applied to an archived data set, which was not normalised. At Lauder the data were not normalised.
The standard procedure for computing ozone above the profile top (the residual ozone) is to assume a constant mixing ratio equal to the mixing ratio at the top of the profile. Because the profile is the most uncertain near the top, due to uncertainties in the pumping efficiency, another procedure is to use a climatology based on SBUV profiles to get the residual (McPeters et al., 1997). This was done for the NOAA/CMDL and Wallops Island data.
Before a profile is normalised to the total ozone, it is important to apply all altitude dependent corrections. Since a single factor is used in correcting the integrated profile to the total ozone an uncorrected error in one part of the profile will be translated into errors in other altitudes. This is illustrated in the trend computation at Uccle for various corrections applied to the profile (fig. 1.28). Even though the SO2 correction (discussed later) and pump corrections mainly apply in the lower and upper portions of the profile respectively, they affect the entire profile. At Uccle both of these factors have changed with time but have been accounted for in the final data set.
The re-evaluated data set of ozone soundings at Uccle from 1969 to 1996 was used for a sensitivity study of instrumental effects on calculated trends. Two effects were explored, the potential effect of the pump correction, and that of SO2 interference. The results are shown in Figure 1.28. The calculated trends are based on a least squares analysis of de-seasonalised data. With the standard algorithm and corrections for calculation of ozone profiles for Brewer Mast sondes described by Claude et al. (1987), the ozone trend is -1.4%/year in the middle troposphere.
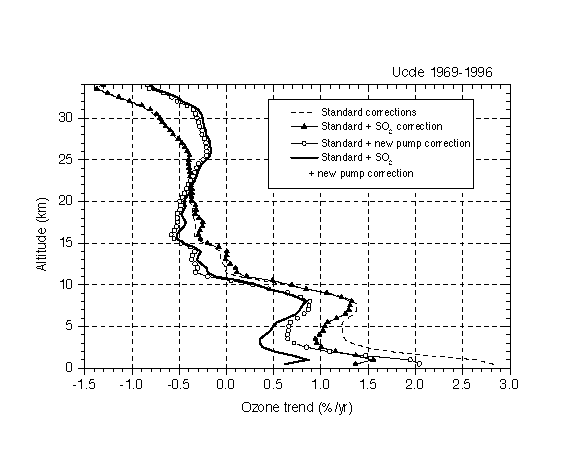
Figure 1.28. Trends at Uccle computed after having applied different corrections to the data.
Before re-evaluation of the Uccle time series a jump was observed in 1989, resulting in too high ozone values in the troposphere and too low values above the ozone maximum (~22 km). After application of the pump efficiency profile that was measured in the laboratory (which shows much higher pump corrections than adopted in the standard profile) this jump was largely removed. Since each ozone profile is normalised with respect to the measured ozone column, the effect of a new pump correction profile propagates to the entire profile, although it is largest at the upper altitudes. Consequently the calculated ozone trends are affected for the entire profile, with trends of -0.8%/year at 33 km, -0.5 %/year in the lower stratosphere, and 0.6-0.8%/year in the middle troposphere.
The SO2 levels in the lower troposphere above the urban area of Brussels decreased rapidly in the 1970s and to a lesser extent in the 1980s. After applying a correction for the SO2 interference as described by De Muer and De Backer (1994a), the ozone trends in the boundary layer are reduced by about half. Tropospheric trends with both corrections applied are 0.35-0.85%/year. Changes in boundary layer ozone also propagate to trends at other altitudes because of the normalisation procedure, but changes in the upper tropospheric and stratospheric trends are small. The corrections applied to the data here have little effect on the trends calculated near the mean level of the ozone maximum. Trends should be most reliable around that level.
The issue of SO2 interference is likely largest for Uccle of all the sonde stations, since the measurements are made in an urban area. SO2 may have affected boundary layer values for ozone for Hohenpeissenberg, Wallops Island, and Sapporo, as discussed in Logan (1994), but probably to a lesser extent. No attempt has been made to account for potential SO2 effects at other stations.
At some stations, primarily at high latitude, a much smaller number of independent total ozone measurements are available. In these cases an average correction is applied (the BM sondes) or the profile is left un-normalised (ECC and Japanese sondes). The profile also cannot be normalised to the total ozone if the balloon does not reach sufficient altitudes so that the integrated profile from the sonde encompasses most of the ozone layer. This cut-off altitude is between 15-20 hPa for most stations. The use of the climatology for computing the residual would probably allow a greater number of the profiles to be successfully normalised.
The comparison between the integrated sonde total ozone and the measured total is also a factor used to determine the quality of the measured profile. Profiles with correction factors outside prescribed limits are usually rejected. For ECC and Japanese sondes these limits are often set at 0.80 £ C.F. £ 1.20 and for BM sondes 0.90 £ C.F. £ 1.5. The variation of this correction factor for various locations and types of sondes is shown in Figure 1.29. Periods when the correction factor is flat indicate that an average correction was applied (primarily the Canadian sites). The correction factor should not be the only criterion used for judging of profile quality, though it is often the only one available to the user of archived data. By including the profile in the archived data set, the originator of the data has usually judged that the profile is of acceptable quality.
Click here to download Figures 1.29 (a), (b) and (c) by anonymous ftp.
1.8.4.2. Procedural and Environmental Factors Influencing Trends
Several factors which may influence trends are considered within this group. They include: (1) changes in operating procedures, (2) changes in instrument type, (3) changes in ozonesonde construction, (4) radiosonde changes and error in radiosonde measurements, and (5) boundary layer pollution.
Changes in Operating Procedures
For BM sondes the procedures described by Claude et al. (1987) are generally followed with various modifications. These procedures were not implemented uniformly in time at all three BM sites, however. All of the BM stations have improved their pre-flight conditioning procedures including better cleaning of the sondes and longer exposure to sensing solutions. The primary influence of such changes over time is likely to be in the troposphere. At Uccle the effect of improved techniques was evident and a correction has been applied to the data.
Procedures for preparing and operating ECC sondes are described by Komhyr (1986) and these are generally incorporated into the Vaisala system manual. Many of the deviations from these procedures are related to the algorithmic factors described in the previous section. Recently, changes to the sensing solution have been introduced at Lauder and Wallops Island. These have occurred recently enough that they will have little influence on the trend determination for this report.
A change in launching time at sites with a large diurnal variation may influence the trend at the lowest altitudes. At Edmonton and Payerne such an effect has been found. At Payerne a correction has been applied based on nearby continuous surface measurements. At many sites the frequency of measurements has varied greatly over the period of observation with most stations having significant gaps in the record (see Figure 1.29).
Changes in Instrument Type
Of the records being considered for this report, the only instrument type change was in 1979 from the BM to ECC sonde at four Canadian stations. The BM sondes were not prepared according to the procedures of Claude et al. (1987) but used an earlier, less rigorous procedure with no special cleaning or calibration. Because of the shift in tropospheric ozone amounts at the time of the switch from the BM to the ECC sonde, the combined tropospheric record has not been deemed suitable for trend determinations by the program investigators (Tarasick et al., 1995).
Changes in Ozonesonde Construction
Modifications have been made in the manufacture of all three types of sondes. Most of these seem to be relatively minor in terms of the effect on the data record. A temporary deterioration in quality of the BM sonde was noted with the relocation of the factory in 1989. There are strong indications that pump performance of the BM sondes has also deteriorated with time based on recent pump efficiency measurements made on older and newer sondes at Uccle (DeMuer, private communication, 1997). At Uccle this change has been accounted for in the post-flight processing. At Hohenpeissenberg and Payerne some modifications in the operating procedures seem to have compensated for the change in instrument quality.
The ECC sonde has gone through several model changes. Most ECC records begin with the 3A sonde. The 4A sonde, introduced in the early 1980s, had a redesigned pump that was more efficient at higher altitudes. Differing curves for the pump efficiency correction for the 4A sonde dependent on the amount of sensing solution (affecting the head pressure) were recommended. The 5A sonde is identical to the 4A except it is designed to be used with a digital electronic interface. Recently a 6A sonde has been introduced with a thermistor for measuring the pump temperature mounted in the pump. In 1994 a second manufacturer began supplying sondes. These are nearly identical in construction to sondes from the competing manufacturer.
The Japanese sonde was modified in 1979 to include the radiosonde and ozonesonde in a single integrated package. The construction of the sensor may also have changed at this time from a double- to single-cell design. No apparent changes in sonde performances have been noted with these changes.
Radiosonde Changes and Errors
The radiosonde to which the ozonesonde is coupled is the source of error in the ozone profile determination through errors in the pressure and temperature determination, which affect the computation of ozone mixing ratio and altitude. Bias errors may appear when there is a switch from one radiosonde type to another. Such a switch has occurred at Uccle, Payerne, Hohenpeissenberg, the NOAA/CMDL stations, the Canadian stations, and Lauder. DeMuer and DeBacker (1994b) compared both the VIZ (without hypsometer) and Vaisala radiosonde to radar measured altitudes and found that at 30 km the Vaisala sonde gave altitudes ~300 m greater and the VIZ sonde ~800 m less than determined by radar. At 30 km the error in ozone partial pressure is about 7% for altitude deviations of 500 m. Switching from one radiosonde to another can thus introduce significant errors.
At several sites (NOAA/CMDL and Hohenpeissenberg) the VIZ radiosonde was used with a hypsometer that accurately measures the pressure at higher altitudes (Parsons et al., 1984). Only at the Japanese stations have the radiosonde sensors remained the same over the record. At Uccle and Payerne corrections have been made for the change in radiosonde type and errors in pressure measurement.
Boundary Layer Pollution
Sulphur dioxide is a negative interferent in electrochemical sondes of all types. Near urbanised areas and in the case of Hilo, Hawaii, the presence of an erupting volcano, SO2 can have a significant impact on boundary layer ozone measurements. It usually takes a period of time (several minutes) for the accumulation of SO2 to be purged from the sensor, which could affect measurements 1-2 km above the boundary layer itself. In the Uccle record, the changing SO2 concentrations with time are accounted for to some extent (see figure 1.28), although complete SO2 measurements are not available. At Hilo the data below ~650 hPa are probably not very reliable during periods of volcanic activity and air flow toward Hilo. At some places strong NO sources near the launch site may artificially depress the ozone amount which would make such measurements unrepresentative of regional conditions. In recent years the control of a number of pollution sources may artificially produce an increasing trend in ozone near the surface if the changing pollution conditions are not accounted for.
Estimates of the contribution to the trend error for a number of the factors discussed previously are summarised in Table 1.15 for each ozonesonde type at three altitudes. These are considered likely estimates for the ensemble of stations using a particular type of ozonesonde. The uncertainty could be much larger for a particular factor at an individual station.
|
|
|
|
|
|
|
Normalisation to total ozone |
5 km |
|
|
|
| 20 km |
|
|
|
|
| 30 km |
|
|
|
|
|
Pump efficiency correction |
5 km |
|
|
|
| 20 km |
|
|
|
|
| 30 km |
|
|
|
|
|
Ozone zero signal |
5 km |
|
|
|
|
(background current) |
20 km |
|
|
|
| 30 km |
|
|
|
|
|
Pump temperature |
5 km |
|
|
|
| 20 km |
|
|
|
|
| 30 km |
|
|
|
|
|
Boundary layer/SO2 pollution |
5 km |
|
|
|
| 20 km |
|
|
|
|
| 30 km |
|
|
|
|
|
Pressure/altitude measurements |
5 km |
|
|
|
|
(radiosonde) |
20 km |
|
|
|
| 30 km |
|
|
|
|
|
Unknown procedural changes |
5 km |
|
|
|
| 20 km |
|
|
|
|
| 30 km |
|
|
|
|
|
Sum of the Uncertainties |
5 km |
|
|
|
| 20 km |
|
|
|
|
| 30 km |
|
|
|
Table 1.15. Measurement Uncertainties Influencing Trends in Ozone Measured by Ozonesondes (%/year), 1970-1996.
A number of stations in Europe and North America have records of sufficient length and quality that they should be the preferred choices for trend analysis. These are: Hohenpeissenberg (Germany), Payerne (Switzerland), Uccle (Belgium), the stations run by NASA and NOAA in the United States, and the Canadian stations from the beginning of the ECC record (1980). A significant number of stations (e.g., Haute Provence) have started making soundings too recently for reliable trends to be deduced. A number of others (e.g., Aspendale, Lindenberg) have switched sonde types within the past 5-10 years. There are well-known problems with attempts to derive trends from combined ECC and Brewer-Mast data sets [Tarasick et al., 1995]. Many stations have recently revised their total ozone records and these have been applied to the sonde time series where total ozone normalisation is currently practised. Even if the total ozone normalisation (correction) factor is not used to correct the sonde profile, it should be calculated, as it provides an excellent test for suspect data. Trends or discontinuities in normalisation factor time series are also cause for concern (see Figure 1.29).
The records discussed below have all been subjected to careful examination and re-evaluation by the scientists responsible for ensuring the quality of the data for each station. Correction factors have been examined for trends and discontinuities, and in most cases the total ozone record has also been re-evaluated. Corrections and changes and their effects (if known) are described, and known problems are noted.
Hohenpeissenberg
Regular soundings with Brewer-Mast ozonesondes were started at Hohenpeissenberg in November 1966. VIZ Hypsometer radiosondes (types 1072, 1192, 1292 and 1393) were used, with occasional use of other types, until the fall of 1994, when the station switched to the Vaisala RS80-30 NES. Major differences have been detected in altitude calculations due to differences in pressure measurements between the sondes. Quantifying and correcting of this break in the time series is in progress. The pre-flight preparation procedures of the sondes have been consistent and are in general as described in Claude et al., [1987]. Some modifications of these procedures have been introduced fairly recently, including the use of potassium cyanide for cleaning the silver electrode and filling the sonde with KI solution at least 24 hours before launch. No systematic effects of these changes on sonde performance have been noted. Data reduction methods and pump corrections are consistent through the record. The recently re-evaluated Dobson total ozone time series (Köhler and Claude, 1996) has been applied to the ozonesonde record, with the use of Bass-Paur absorption coefficients. At the same time the entire sonde record was re-examined, and suspect data points, especially above 17 hPa, were removed (Claude et al., 1996). The resulting time series shows less scatter in total ozone normalisation factors, but very similar trends.
Uccle
Regular soundings have been made since 1969 with Brewer-Mast ozonesondes. The pump temperature has been measured since 1990 when Vaisala (instead of VIZ) radiosondes were put into use. For soundings before 1990 a mean pump temperature profile (derived from the 90-91 data) is used. The altitude scale of profiles obtained before 1990 has been corrected for the mean difference between the VIZ and Vaisala radiosonde altitude measurements using wind-finding radar data for reference altitude measurements (De Muer and De Backer, 1994b). A correction for SO2 levels in the lower troposphere over Brussels, based on ground-level SO2 measurements, has been applied. This affects tropospheric values especially during the 1980s (De Muer and De Backer, 1994a). The change to the use of an electrostatic discharge ozoniser instead of a UV lamp for pre-conditioning of the sondes, beginning in October 1981, caused an apparent jump in tropospheric ozone values. This effect was corrected in the earlier data (De Backer, 1994) based on a comparison of ascent and descent profiles (after deconvolution of the profiles to take the time response of the sensor into account) during a 2-year period both before and after October 1981.
Special attention has been paid to the best possible application of the pump efficiency correction to the profile. Since 24 April 1996 the measured pump correction profile for each individual sonde is applied whenever it is available. Since 22 May 1992 when the absolute calibration of the efficiency of the sonde pumps started, the pump correction profile that is applied is such that the overall correction factor is the same as the correction factor measured in the laboratory. From 28 April 1989 to 21 May 1992, which was a period with worse ozonesonde pump characteristics, an empirical relationship between the overall correction factor and the pump correction profile deduced from the soundings after 21 May 1992 is used.
Homogenised Dobson values on the Bass-Paur scale were used to normalise all the ozone profiles. For the set of data used in this study, only the profiles with an overall correction factor between 0.92 and 1.50 were retained.
Payerne
Measurements started in November 1966 in Kirchberg, near Zurich. Since August 1968 measurements have been performed at Payerne, 150 km to the west. Launch times have changed several times, with measurements since January 1982 made at 12:00 UT. Important changes in pre-flight procedures occurred in 1977, 1983, and 1993. Before 1976 sondes were prepared at Zurich and then transported to Payerne for launch. In 1983 the improved pre-flight protocol of the group at Hohenpeissenberg (Claude et al., 1987) was adopted. Since 1993 several changes have been introduced, including complete disassembly and meticulous cleaning of new sondes, followed by repeated calibration with fresh sensing solution on each occasion. Since January 1983 a four-point calibration with an UV photometer has been routinely performed. This method allows the determination of the background current (although this information has not yet been used), as well as giving some information on the quality of the sonde. Since 1984 pump flow has been measured by an electronic flow meter, rather than a bubble apparatus. Some adjustments in order to homogenise the measured flows were applied. Before November 1980 the VIZ radiosonde was used. This was changed to the old mechanical Swiss radiosonde CH, then to the new electronic Swiss Radiosonde SRS-400 in April 1990. The latter change caused a marked discontinuity in the time series that has been corrected by applying a regression model on 23 standard levels. A constant temperature of 300K is assumed for the box with the VIZ sonde, and 280K afterward. The standard pump efficiency correction is applied throughout the data record. A correction of 1.04 (the ''Dütsch factor'') was applied before November 1980, as well. This has no effect on normalised profiles. All flights are normalised, either to the Dobson at Arosa (200 km east), or where this is unavailable the TOMS measurement. An estimated (average) correction factor is used before 1978 or after 1993 when no measured total ozone is available. Calculation of the residual between 30 and 10 hPa is via the SBUV climatology between 30 and 17 hPa, and assuming constant mixing ratio between 17 and 10 hPa. Soundings ending below 30 hPa are rejected.
NOAA/CMDL
The Climate Monitoring and Diagnostics Laboratory (CMDL) has used the ECC type ozonesonde throughout its measurement program. The three primary time series, which began in the early to mid-1980s, are from Boulder, Colorado; Hilo, Hawaii; and South Pole, Antarctica. There have been several operational changes over the course of the program. The first of these was the conversion from the analogue system to a digital system, which took place in 1991. The analogue system was based on the VIZ radiosonde with hypsometers for measuring pressure at pressures less than about 50 hPa. This system also measured the ''box temperature'' as a surrogate for the pump temperature required to determine the volume of air pumped into the sensor. With the advent of the digital system the Vaisala RS-80 radiosonde was mated with the ozone sensor through the TMAX-C interface board. With the conversion to the digital sonde the measurement of the instrument temperature was switched to a place on the pump body. In 1994 the supplier of the ozonesonde pump/sensor was switched from the Science Pump Corp. to EnSci Corp. Although the design is very similar there may have been some slight differences in performance characteristics. Starting in 1991 individual pump efficiencies were measured. Soundings have been reprocessed using uniform procedures throughout the time series. These procedures include: (1) Use of pump efficiency corrections prior to 1991 that are an average of the measured efficiencies made since 1991. (This has included the development of a unique oil bubble flow-meter technique for checking earlier pump efficiency measurement methods.) (2) Subtraction of a constant background current throughout the entire flight profile. (3) A correction for the over sensitivity of the 1% sensing solution to ozone exposure (required by the use of the larger pumping efficiency corrections measured. This correction is based on measurements using solutions of varying composition in comparison to a calibrated photometer). (4) Normalisation to Dobson total column ozone amounts that have been reprocessed so that they are on the Bass-Paur scale. In addition the residual ozone has been calculated using the SBUV climatology rather than the extrapolation using a constant mixing ratio. Using these procedures a relatively homogeneous data set has been produced. Corrections that have not been made are for possible inconsistencies in the pressure and temperature measurements associated with the change in radiosonde. The changes introduced by the change in radiosonde appears to be relatively small.
NASA/Wallops Island
This station began soundings in May 1970. Measurement density varies from one or more observations per week to two per month, dependent on available resources. A 1.5% KI solution was used through the data of 1994. Beginning with the use of the digital VIZ radiosonde in 1995 (prior sondes were analogue) the station switched to use of 1% solution. Standard operational procedures have otherwise remained the same since the late 1970's. Individual pump efficiency calibrations are made for each sonde in a pressure chamber. The background current (zero offset) correction is independent of pressure. Background current is measured about one-half hour prior to instrument release before the cathode cell has been exposed to ozone. Comparison to a Dasibi UV monitor is made prior to launch, as a quality check. Dobson normalisation factors are also calculated (using constant mixing ratio to calculate the residual), again as a quality check. Neither measurement is used to correct profile data submitted to the World Ozone and Ultraviolet Radiation Data Center (WOUDC), Toronto, Canada. For this study the total ozone record on the Bass-Paur scale was applied to the data to account for changes from the application of the correction factor in the earlier portion of the archived record to the more recent procedure of not applying this correction.
Canadian Network
Prior to 1980 the Canadian network flew sondes of the Brewer-Mast type. These were prepared in the fashion described in Mueller (1976); that is, sondes were conditioned with a high ozone source for about 30 minutes, then filled with solution and launched; no special cleaning or calibration was performed. Sondes were filled with solution about one hour before launch. Correction factors for this period are fairly high (~1.3) and there is considerable scatter. In addition, there is a clear bias in tropospheric measurements that will produce spurious trends if these data are combined with the ECC data of the later period [Tarasick et al., 1995]. These data have not been re-evaluated and are not reliable for trend assessment in their current state.
Since 1980 onwards the Canadian network has flown ECC sondes. Two others have been added more recently. Sondes are flown weekly at all stations, with additional flights at times of special interest. ECC 3A sondes were used in Canada until about 1983, when stations changed to the 4A. Since 1994/1995 the digital ECC type 5A and 6A, manufactured by Science Pump Corp., and the EN-SCI 1Z have been used in Canada. Differences between these types and the 4A appear to be only in the electronics. The sonde is coupled to a Vaisala RS80 radiosonde via an RSA11 interface. Prior to 1993 an analogue system based on the VIZ radiosonde was used. Hypsometers for measuring pressure were used only on a few soundings, on an experimental basis. The possible effect of the change of radiosonde has not yet been examined. Operational constraints have at times required some variation in launch times. This appears to have had a significant effect in the lower troposphere at Edmonton and Alert [Tarasick et al., 1995]. In the mid-1980s at Edmonton mean values increased by about 42% at the surface when the standard launch time was changed from morning to afternoon.
Sonde preparation procedures have been consistent throughout the Canadian program. Solutions have been prepared in accordance with Komhyr (1986), i.e., 2.5 ml of 1% KI solution in the cathode cell and 1.5 ml of anode solution. Concentrations have not been changed at any time in the ECC record, and preparation has been at one central location. Sondes are typically charged with solution one week to one month before launch, and solutions are topped up weekly, where necessary, with solution. Sondes are charged with fresh solution on the day of launch. Sondes are tested before launch with an uncalibrated ozone source and rejected if they show excessive background current, but complete laboratory characterisation of individual sondes has not been standard procedure in Canada. Standard pump corrections recommended by the manufacturer (which necessarily differ between 3A and 4A models) have been used for all sondes. The correction curve supplied in 1983 has been used for all 4A flights; this was changed slightly in Komhyr (1986) and as the Vaisala software uses the newer correction curve this has caused a change with the 5A sondes. Pump flow rate at surface pressure is measured in the pre-flight procedure and used in the data reduction. A pressure-dependent correction for background current is used throughout the Canadian record. At several stations there are significant trends in the recorded background current, which could affect derived trends in the upper troposphere, if the background current were in fact constant with altitude.
Where a total ozone measurement is available, profiles are scaled linearly to the total ozone measurement. The residual ozone above 17 hPa is approximated by the average of all measurements above that height, using the assumption of constant mixing ratio. No correction is applied for flights that fail to reach 17 hPa. All correction factors have been adjusted to the recently re-evaluated time series of Brewer total ozone data for those stations. Zenith sky total ozone measurements were not used for the ECC portion of the record for this study. At the arctic stations total ozone measurements are not available in the winter, which may lead to a seasonal bias in the corrected data. Overall, the correction factors at Canadian stations for the ECC record are very close to 1.0, and show insignificant trends.
Japanese stations
Three stations in Japan have been operating since late 1968 (in addition to the Japanese Antarctic station, Syowa). A fourth was added in 1989. Since 1991 soundings are weekly; before that time they were bimonthly, with no soundings in the summer. The Japanese sonde is a galvanic cell like the Brewer-Mast, with a carbon anode. Before 1979 a model with two solution chambers was used. This change has changed response time to ozone changes. Sensing solution is 0.04% KI with 34% KBr and a buffer. This has not changed. Temperature is measured near the inner surface of the solution cell. Background current is measured twice: 15 minutes before the launch, and also during the pre-flight calibration, at about 20 minutes after exposure of the cell to ozone. Background current is subtracted with decreasing atmospheric pressure. Pump efficiency under low pressure is calculated by from an empirical formula. Values at various pressures are tabulated in Table 1.15. Normalisation to the Dobson total column ozone is done assuming constant mixing ratio after balloon burst. The total ozone records have been re-evaluated for Bass-Paur absorption coefficients. There have been some changes in radiosonde, and a radiation correction has been applied to temperature sensors since 1979 (when the new Japanese ozonesonde was introduced). This may have caused an altitude shift in the measurements.
NIWA/Lauder
The National Institute of Water and Atmospheric Research (NIWA) has been performing ECC ozonesonde soundings since August 1986. Ozonesondes flown have included the 4A, 5A and 1Z series ozonesondes manufactured by the EN-SCI Corporation (1Z) and the Science Pump Corporation (4A and 5A). The 4A sondes were flown from 1986 to October 1989 with telemetry, pressure, temperature and humidity information being provided by a 1680 MHz VIZ radiosonde. From 1989 the instrument has been coupled to a Vaisala Incorporated, 403 MHz RS-80-15 meteorological radiosonde. Coupling is achieved through TMAX-HMOS electronic interface circuitry. A modified version of Terry Deshler's (University of Wyoming) ANLOZ program is used to process the data. Measured parameters telemetered to the ground receiving station are ozone, sonde pump or box temperature, air pressure, air temperature and humidity. In general, 5A sondes have been flown between August 1989 to June 1994, and 1Z sondes from July 1994, although there are occasional exceptions to this. Frequency of flights is generally one per week. From September to about the middle of December the frequency of flights is generally two per week. This can vary for intensive campaigns.
From 3 August 1986 to 31 July 1996 the KI cathode solution concentration was 1%. Based on recommendations by Komhyr (private communication), a 0.5% KI cathode solution concentration has been used from 1 August 1996. This change has produced better comparisons with quasi-simultaneous or simultaneous Dobson total column ozone measurements (Bass-Paur coefficients) and ozone lidar measurements. Three dual ozonesonde soundings consisting of ozonesondes using 1% and 0.5% KI cathode solutions have been made at Lauder (October 1996, March, and June 1997). With these results as well as field and laboratory comparisons carried out by other groups we intend to eventually be able to homogenise these two data sets.
Two pump efficiency corrections are employed at Lauder. For 4A and 5A sondes, the pump efficiency corrections used are based on measurements made at the University of Wyoming in 1988 by Terry Deshler's group. For 1Z sondes the corrections in EN-SCI (1996) are employed. Third order polynomial fits to the quoted pump efficiency correction factors are used to interpolate values for other pressures. The two corrections are quite different, and reflect, to a certain extent, the different methods that are used to determine pump efficiency corrections. Results do suggest, however, that there is a systematic bias between 5A and 1Z series sonde pump performance in the mid-stratosphere.
The background current measurement is determined after all preparations have been done and the sonde is about to be launched. In most cases this background has been obtained shortly after exposing the sensors to ozone, but in more recent times the pre-launch procedures have been performed up to several hours before the actual launch - the background current has then, subsequently, stabilised at a lower value. For 5A and 1Z sondes the background current is assumed to remain constant through the flight. For 4A sondes a pressure scaled background current has been applied to the data.
Normalisation to total column ozone is not done, but a normalisation factor for all flights is determined based on an assimilated total column value from sources such as Dobson (Bass-Paur scale), Nimbus-7 and Meteor-3 TOMS V.6 and V.7, and ground-based scanning spectrometers. For sondes containing a 1% solution, ozone data is scaled by 0.9743 to match the Bass-Paur coefficient correction to Dobson data. This is not done for the soundings using a 0.5% solution. A residual ozone calculation is made by using a 40 to 50oS zonal SBUV climatology (McPeters et al., 1997). This calculation is applied from the top of the flight to 1 hPa.
For 4A sondes a thermistor measuring box temperature was positioned near the base of the ozonesonde. For 5A sondes the thermistor was glued to the base or top of the Teflon block near the pump. For 1Z sondes the sondes have a thermistor positioned in the Teflon block near the piston. Experiments performed at Lauder suggest that the 5A sonde 'pump temperature' is between 2-3K cooler than the 1Z sonde 'pump temperature' throughout the sounding, while the 4A sonde 'box temperature' measures about 1K cooler than the 1Z sonde in the troposphere, increasing to about 4K in the mid-stratosphere. Temperature changes of this magnitude probably do not have a big impact of the profile. In recent years work has been done to standardise the package configuration and general procedures. This was done specifically to generate consistent internal temperature profiles which give an indicated temperature between 10-17oC by the top of the profile.
No correction for direct radiative heating of the radiosonde temperature sensor has been made to the data. From 28 March 1996 a shadow band around the radiosonde temperature sensor has been used for day time flights. Corrections to pressure have been made to all backscatter sonde flights (incorporating ozonesondes) since 1992 – these packages are flown approximately monthly – these corrections were made by measuring the pressure differences between radiosonde and test unit at 10 or 15 hPa. Corrections to other sonde flights have been made since 7 August 1996, based on comparison with an accurate pressure sensor at the station and assuming a constant difference through the flight.
Other Stations
A number of other stations have records whose overall quality remains unassessed, but which represent the only sources of ozonesonde profile data for a significant portion of the globe. These include the Australian and Indian stations, as well as Natal, Brazil. In some cases the data record is sparse or intermittent. Because of their geographic locations, these data sets must be considered in a global trends assessment, but they should be regarded with less confidence than the data records described above.
![]()