 |
Stratospheric Processes And their Role in Climate
|
||||||||
| Home | Initiatives | Organisation | Publications | Meetings | Acronyms and Abbreviations | Useful Links |
![]()
|
Stratospheric Processes And their Role in Climate
|
||||||||
| Home | Initiatives | Organisation | Publications | Meetings | Acronyms and Abbreviations | Useful Links |
![]()
Troposphere-stratosphere chemical-climate models are needed for climate assessment purposes. One obvious example of this need is in the consideration of the total climatic effects of CFCs. In addition to the direct radiative effect from CFCs, the effects of the resulting stratospheric ozone depletion must be considered. These models are also important for the assessment of various anthropogenic effects on the ozone distribution (e.g., from CFCs, aircraft, etc.). Currently these models are relatively crude, and SPARC is engaged in four activities aimed at : improving confidence in troposphere-stratosphere general circulation models; assessing the understanding of stratospheric variability and the quasi-biennial oscillation; and establishing a reliable data base of stratospheric aspects of climate forcing for use in current climate models.
Troposphere-stratosphere general circulation models utilise different physical parameterisations (e.g., convection, gravity waves, radiative transfer) and numerical techniques. Consequently intercomparisons are necessary if the climate and ozone assessments using these models are to be understood. Recognising this, SPARC initiated a working group on the intercomparison of troposphere-stratosphere general circulation models, an activity which is growing and will continue for the next few years.
The results of troposphere-stratosphere general circulation models must be checked against atmospheric observations. In order to update previous climatologies and benefit from recent atmospheric measurements, a current SPARC activity is to assemble a new troposphere/stratosphere climatology for comparison with the troposphere-stratosphere general circulation models.
Interannual dynamical variability and the quasi-biennial oscillation (QBO) affect the global distribution of stratospheric forcing on climate. For this reason, SPARC is studying possible initiatives to better understand the QBO and its possible role in coupling the stratosphere and troposphere.
The SPARC scientific steering group has recognised the need in the climate modelling community for a valid data base of the best estimates of parameters that determine stratospheric aspects of climate forcing. An important technique to acquire such a data set is data assimilation, whereby observational data are combined with forecast fields from a GCM to produce an optimal, self-consistent picture of the evolution of the stratosphere. To capitalise fully on stratospheric data from forthcoming satellite missions, notably the European Space Agency's Envisat mission, and NASA's Mission to Planet Earth, data assimilation techniques must be developed to assimilate the new observations, and to combine and reconcile them with other data. The necessary scientific investment can build on the sophisticated data assimilation techniques currently used in operational weather forecasting. The forecast models must contain a good representation of the meteorology and chemistry of the stratosphere, and this should be a major stimulus for the improvement of the representation of the stratosphere by GCMs.
In recognition of the importance of the observational data base for SPARC issues, the Scientific Steering Group is establishing an ad hoc working group to chart the way forward.
The GCM-Reality Intercomparison Project for SPARC (GRIPS) is an initiative in which a comprehensive study of our ability to model the troposphere-stratosphere system with comprehensive general circulation models (GCMs) has been undertaken. This means first our capability of reproducing the current climate and its variability, particularly the links between the troposphere and the middle atmosphere. It also extends to studies of the influence of stratospheric trace gases on climate and an assessment of our ability to predict the impacts of their change. Such effects can only be examined with comprehensive GCMs which include representations of all physical processes thought to be relevant to the atmospheric circulation.
Many simpler models can be applied to process studies, such as the propagation of planetary waves from the troposphere into the middle atmosphere and their effects on the stratospheric circulation, or the transport of ozone due to these waves and the ensuing chemical effects. While such models are useful for our understanding of individual processes and their likely importance for climate, they are not the focus of GRIPS. This SPARC initiative is concerned with the climate system: the interactions between these individual processes and their relative importance. Two of the most essential questions to answer are:
These two questions essentially define the short- to medium-term and the long-term objectives of GRIPS. They will be investigated in a work plan which will be described in detail in the rest of this section.
The scope of the work plan evolved first from informal discussions between the co-ordinators and then with other scientists involved in climate-middle atmosphere modelling. The details of the individual exercises were discussed in much detail at two international workshops, held in Victoria, Canada in March 1996 and in Berlin, Germany in March 1997. These workshops were important, in that most of the climate-middle atmospheric modelling groups were represented and the discussion was well focused on the problems with and the successes of these models. The workshops thus serve as an important meeting place for discussions on such models; GRIPS should then serve as a forum for such interactions and exchanges and annual workshops are planned. In 1988 a workshop is planned in March at the NASA GSFC. The most important achievements of the workshops are:
(a) the opportunity to discuss modelling with a like-minded community;
(b) the discussion of results obtained from individual GCMs and their implications for the wider community;
(c) the comparison of diagnostics from a wide range of GCMs, which allows assessments of our ability to model the climate system; and,
(d) the proposal and implementation of controlled experiments with some or all of the participating models, so that a consensus opinion of the atmospheric response to changes in certain key forcing features can be determined.
Again, these aspects fit into the three different phases of GRIPS, which will now be described.
The short term-objective of GRIPS (Phase 1) is to produce some authoritative documentation of our ability to simulate the current climate of the troposphere and stratosphere using the comprehensive GCMs. The groups participating (table 4.1) have all developed comprehensive GCMs models which can be applied to the climate-middle atmosphere problem. While some of these models are still relatively new, others have longer pedigrees and have been applied to problems such as the effects of including the middle atmosphere on the modelled tropospheric climate, as well as the problems in middle atmosphere dynamics, and influences of stratospheric change on the climate. An important consideration is thus how the newer models compare to the longer-established ones, both in terms of the basic performance (in Phase 1) and, ultimately, in climate-change scenarios.
An ideal experiment would be to run all of these models for the same time period using identical boundary conditions. This is, unfortunately, an impractical suggestion. Since most of the models have been integrated for some multi-annual period, an initial approach is to compare these existing model runs and look for aspects where they all agree with reality and to isolate common deficiencies. A set of 'basic' quantities to be compared has been compiled during the two workshops; this is summarised in table 4.2. These quantities describe the zonal-mean state of the atmosphere, certain aspects of the stationary eddy fields, and include a set of diagnostics describing the forcing of the zonal-mean flow.
The data were requested at specified pressure levels, coincident with standard NCEP (National Centers for Environmental Prediction) pressure levels in the troposphere and suitable levels for intercomparison with available stratospheric data: 1000, 850, 700, 500, 300, 200, 100, 70, 50, 30, 20, 10, 5, 3, 2, 1, 0.5, 0.3, 0.2, 0.1, 0.05, 0.03, 0.02, 0.01~hPa. Some flexibility is allowed (obviously the data should stop at the upper boundary of the model), but any deviations from the standard levels must be reported to the co-ordinators and data are likely to be re-interpolated for some purposes.
|
|
|
|
|
|
|
|
|
|
|
|
|
|
|
|
|
|
|
|
|
|
|
|
|
|
|
|
|
|
|
|
|
|
|
|
|
|
|
|
|
|
|
|
|
|
|
|
|
|
|
|
|
|
|
|
|
|
|
|
Table 4.1. Participating groups in the GRIPS project, with the contact scientist.
No preferred format was requested, since this was regarded as a potential obstacle for groups providing data. Practically, the data have been collected in the format preferred by the provider, along with routines which read these data. They were then transformed into the format of "GrADS", a convenient graphics package for meteorological display, originally developed by B.Doty at the University of Maryland. Several groups provided their data in GrADS format, which proved to be very convenient for the GRIPS initiative. Following receipt and, if necessary, transformation of the data, some simple quality control was performed which necessitated contact with the providers, usually over the electronic mail system. In this manner, initial problems were solved and the data were displayed in a common format. By the time of the First SPARC General Assembly (December 1996), data from nine models had been collected (see Pawson et al. 1997) and an initial intercomparison of some aspects of the zonal-mean states of the models was performed. In the meantime, data from two of those models (CNRM and FUB) have been replaced with newer integrations, the MRI/CL data have been replaced with new diagnostics extending to 1hPa, and more data have been collected from each of the models. Further, three groups (GSFC, LaRC, and UKMO) have provided data from their models.
|
|
|
|
|
|
|
|
12 months for 10 years (if possible) |
|
|
|
|
12 months for 10 years (if possible) |
|
|
|
|
12 months for 10 years (if possible) |
Standard levels Stationary and transient components |
|
|
|
12 months for 10 years (if possible) |
|
|
|
|
12 months for 10 years (if possible) |
|
|
|
|
12 months for 10 years (if possible) |
|
|
|
|
12 months for 10 years (if possible) |
|
|
|
u (60°N/S), T (NP/SP) |
|
|
Table 4.2. List of the quantities to be compared in 'Phase 1' of GRIPS. These should be collected in Berlin for a direct 'level 1' intercomparison.
In Pawson et al. (1997) the models were compared to a 17-year mean climatology based on National Center for Environmental Prediction (NCEP) data, as in Randel (1992) --- see also figure 4.3 for the zonal-mean wind climatology in January and July. Closer co-ordination with the SPARC climatology initiative (section 4.3) is envisaged as GRIPS progresses. The climatological zonal-mean wind field for January as simulated by four of the GRIPS models is shown in figure 4.1. This shows that there is some considerable disparity between the simulations: all four models capture the essential features of the observations (figure 4.3) with easterlies in the stratospheric summer hemisphere (although one model has very weak westerlies at high southern latitudes) and the transition from westerlies to easterlies often occurs higher in the stratosphere in the models. The strength of the subtropical jet in the southern hemisphere is overestimated by three of the four models. By far the largest differences are in the northern winter stratosphere, where the strength of the maximum westerlies varies from less than 30ms-1 (bottom left) to more than 40ms-1 (top left). None of the models simulates the equatorward slope of the polar night jet with increasing latitude which is evident in figure 4.3.
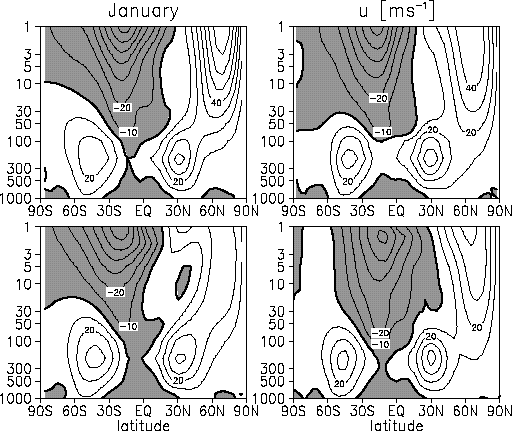
Figure 4.1. Latitude-height sections of the zonal-mean zonal wind in January, averaged over several years, as simulated by four different models. As in figure 4.3, negative values (easterlies) are shaded and the contour interval is 10 ms-1. These four models show the spread of results obtained using current climate-middle atmosphere models.
There are often discrepancies between different climatological estimates of the atmospheric structure. These arise partly from an undersampling of the highly variable atmospheric circulation, partly from the different observational techniques used, and also because different techniques are often used to derive the quantity of interest. Investigations have shown that validation of such quantities as the zonal-mean zonal wind are not particularly sensitive to the choice of reference climatology because the departure of the models from any representative climatology are more pronounced than the differences between the various climatological estimates. For other fields, this is not the case. One example is the temperature in the neighbourhood of the tropical tropopause. At 100 hPa the tropical temperature is somewhat lower in the ECMWF than in the NCEP reanalyses (Pawson and Fiorino 1998), as well as in the data set compiled by Randel (1992). In this case, the choice of temperature climatology can lead to widely differing interpretations of the model errors. Figure 4.2 shows that compared to Randel's climatology, all models are too cold near 100 hPa at the equator, but if the ECMWF reanalyses (Gibson et al. 1997) are used a reference, there is a roughly equal spread about the observational estimate. Such differences are critical to our assessment of the model performance, and would affect the interpretation of more highly derived quantities, such as model estimates of stratosphere-troposphere exchange. The comprehensive data sets based on stratosphere-troposphere assimilation systems at the United Kingdom Meteorological Office (Swinbank and O'Neill 1994) and NASA Goddard Space Flight Center (Schubert et al. 1993) are an important part of the validatory data, but the limited period for which they are available (since 1991), and some uncertainties in some regions of the atmosphere, means that more conventional stratospheric observations will continue to be an essential part of the validation.
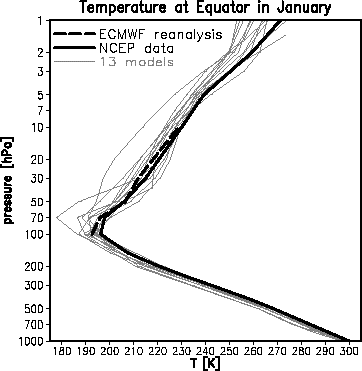
Figure 4.2. Vertical profiles of temperature at the equator from twelve model simulations and two observational estimates. The NCEP observations (discussed in section 4.3) are shown with the thick dotted line. The thick dashed line shows values from ECMWF reanalyses at pressures between 100 and 10hPa. The models are shown by thin lines.
Groups were requested to provide data for each month of 10 simulated years from their models. This proved to be impossible, since some groups do not have the resources to integrate for so long. Most models have five years, but one group provided a 3-year mean and a further group supplied data from a single model year. The intercomparison must therefore account for the significance levels of the data, particularly in the northern stratosphere in winter, when the real atmosphere and some models display a large interannual variability.
No specifications for the lower boundary condition (the sea surface temperature and sea ice distributions) were given. This is because several of the groups had already performed their integrations when the exercise for GRIPS was defined. Climate models generally include interactive land-surface models, so the boundary conditions over land do not need specification. Atmospheric trace gas distributions and aerosols, which affect the radiation transfer, were also not defined by the project. The models all use CO2 concentrations typical of the current climate; some of the models include other well-mixed gases; ozone is generally specified as a zonal-mean climatology which, like the sea-surface temperature, undergoes a repeating annual cycle. Some models (e.g., CNRM, LaRC) include predictive schemes for ozone.
Given these differences between the models, it is clear that extreme care must be taken in the interpretation of the intercomparison. This highlights the importance of the model documentation, which includes details of the sources of such geophysical information, as well as the model formulation (the numerical techniques used and the parameterisations of physical processes included).
The documentation of the models should match the standard of Phillips (1995), for the AMIP models. A successful documentation would provide all necessary information about the numerical and physical aspects of the models, the boundary conditions used in the integrations, and the storage of data. It should include references to published work and also allow for easy updates when the model is changed (while retaining the ability to cross-check the older integrations). This is 'Task 1b' in the list (table 4.3).
The combination of the comprehensive model documentation and the comparison of their climatological structures should provide the basis for a 'status' report, in which the strengths and weaknesses of the current GCMs is thoroughly reviewed. Such a study will provide a strong starting point for future model development, as well as for the interpretation of more highly advanced diagnostics.
A further set of model diagnostics will also be performed for GRIPS; these are summarised in table 4.3 and are outlined here.
|
|
|
|
|
|
|
|
|
|
|
|
|
|
|
|
|
|
|
|
|
|
|
|
|
|
|
|
|
|
|
|
|
|
|
|
|
|
|
|
|
|
|
|
|
|
|
|
Table 4.3. List of the tasks to be performed for phases 1 (short-term) and 2 (medium-term) of GRIPS,
with the co-ordinators of those tasks. All groups should contribute to tasks 1a and 1b.
The 'statistical connections between the stratosphere and troposphere' (Task 1c) will be performed using monthly-mean values of the zonal-mean zonal wind in the troposphere and stratosphere along with temperature and height fields at various tropospheric levels. This task will be co-ordinated by K. Kodera. The objective is to reach some understanding of how well the GCMs can reproduce these observed connections between the troposphere and stratosphere (Baldwin et al., 1994; Perlwitz and Graf, 1995). Some such modes have been isolated in the MRI-climate model (Kitoh et al. 1996), which was integrated with variable sea surface temperatures. The challenges of this task will be to isolate the coupled circulation anomalies in the various models and to attempt to provide some physical interpretation, given the different model climatologies and variability patterns.
Task 1d 'Stratospheric warmings' is an investigation of the occurrences of sudden warmings in the models and some of their synoptic details. Rather than having a distinct leader, this aspect will first be examined on an individual basis. Comparison of the results will then enable some diagnostic strategy to be defined so that a common analysis of all models is produced. This could involve traditional diagnostics of the synoptic evolution of the warmings, analysis in terms of wave propagation and wave-mean flow interaction, and more complex studies of vortex dynamics, all of which illuminate certain aspects of the warmings. The association between the modelled warmings and the tropospheric flow is an important aspect to study, since it is a central theme to SPARC and also a relatively poorly understood feature of the dynamical connections between the troposphere and the stratosphere.
The final four tasks (1e-h) are intended to be pilot studies, initially involving a small number of models. The task-leaders will perform and co-ordinate the studies using data from those groups who have provided them. Tasks 1e and 1f involve the use of high-frequency data to isolate the various travelling (and transient) disturbances in the modelled atmospheres. Proof of the existence of such features is the first step to isolating their forcing mechanisms. Consensus amongst the models may give a firmer physical basis for the interpretation of the results.
Task 1g is a step towards investigating the models coupled with transport and chemistry. There are certain 'fundamental' aspects of the models to investigate, one of them being the representation of the tropopause and the transport of water vapour between the troposphere and stratosphere; this represents a challenge to transport schemes because of the strong gradients near the tropopause. It is not only the transport schemes which may have problems. In middle latitudes the ability of the GCMs to represent the upper tropospheric waves, which lead to strong disturbances near the tropopause, is likely to have a profound influence of the modelled troposphere-stratosphere exchange. In the tropics the ability of the models to simulate realistic tropopause temperatures will determine whether the cross-tropopause fluxes are accurately represented (for example due to the freeze-drying mechanism). Although water vapour will be examined in the first case, the results will also have implications for the exchange of ozone. This task is a precursor to many of the coupled model studies planned in the longer term.
Finally, task 1h is a detailed study of the spatial wave number spectra in the models, examining the energy distribution at different wave numbers and the mechanisms of exchange of energy between the various wave numbers. This is obviously a challenging topic for the dynamicist and it is hoped that the results will show whether there is any convergence as the model resolution is increased or whether the spectra become smaller as the model resolution increases. Such studies are initially directed at the dynamics of the models, having implications for the use of various diffusion schemes, but have relevance for the longer-term plans of coupled modelling since the mixing of chemical species will be affected by this fundamental dynamical behaviour of the models.
The medium-term aims of GRIPS involve some specific model experiments and some tests of the parameterisation schemes. The time frame of Phase 2 is up to about 1-2 years from now. Three tasks have so far been defined (table 4.3), but it is possible that more will be introduced if necessary and practical, especially some more concrete liaison with the gravity wave initiative (section 3.4). At the two workshops, much discussion was dedicated to the form which the GCM experiments could take. There are essentially two types of model experiment to be performed, although the separation is not always totally clear: studies in which the dynamical behaviour of the models are investigated and studies of their response to changes in climatic parameters. In the middle atmosphere, both the radiation scheme and the representation of sub-gridscale gravity wave drag represent important features for the success of a climate model.
In discussing the gravity-wave drag problem, which appears to be essential for the simulation of the middle atmosphere, the existence of a SPARC initiative to investigate gravity waves in some detail was taken into account. This group, chaired by K. Hamilton and R. Vincent, plans studies to improve observations of gravity waves and their parameterisation for GCMs. A close collaboration between that initiative and GRIPS is envisaged. It was decided that GRIPS should attempt to co-ordinate activities with that group: any intercomparison of gravity wave drag schemes which they plan would be followed with interest, and model experiments would be performed within the GRIPS framework.
The eventual decisions reached at the workshops concern some off-line tests of the radiation transfer schemes, some diagnostics of gravity wave drag, as well as some GCM integrations to test the effects of mesospheric drag on the simulations in the lower stratosphere. These are summarised here.
(i) Task 2a: Radiation scheme intercomparisons
The middle atmosphere is partially driven by radiative heating which is one of the major parameterisations in the GCMs. Although many of the radiation schemes were validated in the WCRP/ICRCCM (Intercomparison of Radiation Codes for Climate Models: Luther et al. 1988] these tests were for five climatological atmospheric profiles and the analysis concentrated mainly on the troposphere. Some additional tests for the middle atmosphere are also worthwhile. These should be directed at the latitude-height structure of the heating rates since this has direct implications for diagnosis of the diabatic circulation in the middle atmosphere as well as for the radiative balance in the numerical models. The following exercises will be performed:
(ii) Task 2b: Diagnostics of the gravity wave drag
The first aspect related to gravity wave drag which will be examined
within GRIPS concerns the distribution of gravity-wave drag in
the atmosphere. From the zonal-mean distributions of net heating
rates determined from the radiation calculations (task 2a) it
is possible (often after some correction of the global thermal
balance) to determine the diabatic circulation and thereby infer
the total eddy forcing of the mean flow (e.g., Shine 1989). The
following equations illustrate the essence of the problem, although
the system is somewhat simplified over that which will be used.
Very approximately, the thermodynamic equation can be simplified
to yield a proportionality between the diabatic heating rate ![]() and the vertical component of the residual circulation,
and the vertical component of the residual circulation, ![]() :
:
![]()
![]() (1)
(1)
Here, ![]() is the potential temperature. From the diagnostic calculation
of
is the potential temperature. From the diagnostic calculation
of ![]() , an estimate of
, an estimate of ![]() can be obtained, which will be subject to the uncertainties in
the radiative heating rates. Integrating the mass continuity equation,
can be obtained, which will be subject to the uncertainties in
the radiative heating rates. Integrating the mass continuity equation,
![]() , (2)
, (2)
often after a correction to ensure that the globally integrated
mass flux through each pressure level vanishes, yields values
for the northward flow ![]() . (
. (![]() is the atmospheric density.) Finally, these estimates can be
used in the zonal momentum equation:
is the atmospheric density.) Finally, these estimates can be
used in the zonal momentum equation:
![]() , (3)
, (3)
where ![]() is the Coriolis parameter and
is the Coriolis parameter and ![]() and
and ![]() represent the forcing due to (resolved) planetary-scale disturbances
and (unresolved) gravity waves. Estimates of
represent the forcing due to (resolved) planetary-scale disturbances
and (unresolved) gravity waves. Estimates of ![]() can be obtained from the zonally asymmetric components of the
temperature and velocity fields, so that
can be obtained from the zonally asymmetric components of the
temperature and velocity fields, so that ![]() is the residual required to balance the equation.
is the residual required to balance the equation.
Using this approach, estimates of the zonal-mean gravity wave
drag ![]() can be made for the different radiation schemes. This approach
could place some bounds on the estimates of gravity wave drag
in the upper stratosphere and mesosphere, the limitations being
the accuracy of the heating rate calculations and the estimates
of the planetary wave forcing of the mean flow. This is defined
as Task 2b.
can be made for the different radiation schemes. This approach
could place some bounds on the estimates of gravity wave drag
in the upper stratosphere and mesosphere, the limitations being
the accuracy of the heating rate calculations and the estimates
of the planetary wave forcing of the mean flow. This is defined
as Task 2b.
(iii) Task 2c: GCM studies of the response to mesospheric drag
It was decided that a set of dedicated experiments should be performed study the influence of the mesospheric drag on the atmospheric circulation. This is influenced by the notion of 'downward control', introduced to the literature by Haynes et al. (1991), in which they showed that body forces acting in the mesosphere can, through their influence on the meridional circulation, have an impact on the vertical flow (and hence the thermal structure) at lower levels. There is an obvious application of this idea to the gravity wave drag problem. Many groups are now developing or implementing relatively sophisticated drag schemes into their GCMs, and these have been shown to have an impact on the modelled climatology (e.g., Manzini et al. 1997). However, it is not clear to what extent the `downward control' mechanism will apply in all GCMs. These experiments were thus designed to give a directly comparable series of integrations with all of the participating models, but also so that all participants obtain some useful results for their own model development and validation work.
The model integrations for Task 2c should extend over one winter season in the northern hemisphere, beginning no later than 1 November and running at least until the end of January. Preferably, an ensemble of five integrations (with different initial conditions) would be performed. Use of an ensemble of seasonal experiments would reduce the uncertainties due to different initial conditions and any differences in the boundary conditions and atmospheric composition in the various GCMs. All participating groups would then perform two sets of integrations:
F = t for 90°S-45°S
F =-t .sin(2f ) for 45°S-45°N
F =-t for 45°N-90°N
which is of sinusoidal form equatorward of 45° and constant poleward of this latitude, with easterly forcing in the northern hemisphere and westerly forcing in the southern hemisphere. The constant t has magnitude 2.103 Pa. In the vertical, the forcing will be applied to give a constant body force at all pressures lower than 0.5 hPa, unless the upper boundary of the model is at a higher pressure, when all of the forcing should be applied in the uppermost model layer. These parameters were chosen following a set of experiments performed by B.A. Boville using the NCAR CCM2.
A thorough intercomparison of these model integrations will be made to investigate the effects of the mesospheric drag on the atmospheric circulation.
In the longer term there are many possible directions for GRIPS. One of these would be to perform long integrations for intercomparison, rather like AMIP (e.g. Gates 1992). There is, however, little point in duplicating the AMIP experiments in a different international project. Currently, AMIP is going into a second stage (AMIP-2), in which the models will be integrated for 15 years with specified boundary conditions and fixed CO2 mixing ratios. Since some of the participating models will include a reasonable representation of the middle atmosphere (including some of the GRIPS participants) it is more sensible to collaborate within the AMIP framework. Accordingly, a GRIPS-related diagnostic project has been proposed and accepted by the AMIP-2 committee. This project, `The stratosphere and climate modelling' will be co-ordinated by W.A. Lahoz, R. Swinbank, S. Pawson and G. Roff (a summary is available on the AMIP homepage:http://www-pcmdi.llnl.gov/amip/diagsubs/diagsp.html) and intends to investigate (a) what is needed in a GCM to obtain an adequate representation of the stratosphere and (b) what influence the inclusion of the stratosphere has on global climate simulations. The diagnostic sub-project should follow on from a stratospheric based AMIP-1 sub-project led by C.R. Mechoso (e.g. Mechoso and Kitoh 1996).
In addition to the diagnostic sub-project, an experimental sub-project for AMIP has been proposed. In this project, co-ordinated by S. Pawson and U. Langematz, the sensitivity of the AMIP models to the specified ozone climatology would be investigated; again, there are two aspects to the proposal. First, the sensitivity of the models to the specified ozone distribution should be examined: the question is how sensitive the model climatology is to the observational uncertainty in the ozone distribution? Some such results were reported by Langematz and Radek (1997). Second, the question of how the models respond to an ozone decrease needs to be investigated. This project is currently being held by the AMIP panel for further consideration after the results of GRIPS Task 2a become available.
This latter AMIP proposal has a particularly strong connection with the longer-term objectives of GRIPS. For the longer-term plans, it is important to relate to the central theme of SPARC: namely the importance of the stratosphere for climate studies. One central issue here is the radiative forcing due to stratospheric trace gases, especially the influence of ozone change (which also has a potential coupling with the dynamics by radiative-dynamical coupling). It is anticipated that such experiments would first be performed using specified chemical concentrations for the atmosphere and subsequently introducing perturbations from this state. The exercises in the first two phases of GRIPS would provide important knowledge for such long-term experiments: it is important to quantify how the model differences isolated there affect their responses, which are the subject of this later stage.
Similarly, the investigation of the model's responses to imposed trace gas changes would affect our interpretation of fully interactive chemistry-climate integrations. Many groups are currently coupling chemical modules into their GCMs. There are two extremely important factors regarding the coupled chemistry-climate problem. The first concerns the ability of the GCMs to adequately transport the trace gases; in this regard, the results of Task 1g will be of importance, as will other studies of transport in GCMs which are not directly related to GRIPS. The second concerns the potential feedback of the chemical composition of the atmosphere with the climatic structure: for instance, a cold polar problem (as currently exists in the lower stratosphere of most GCMs) could lead to a low bias in the ozone distribution of the models; this in turn would imply too little absorption of radiation and a subsequent increase in the coldness of the model. As precursors to full coupled chemistry-climate studies, chemical transport models (CTMs) could be used, taking the meteorological fields (wind and temperature data) from a range of GCMs and using them to calculate the transport and chemistry off line. Such studies are currently underway in some groups, but a co-ordinated effort could be organised by GRIPS, and would form an important background to fully coupled experiments with several models.
If, as seems likely, such chemistry-climate experiments were to be performed within GRIPS, the exact experiments would need to be defined precisely, to ensure adequate collaboration with other study groups investigating the numerical problems associated with transport, and initiatives for stratospheric chemistry. Rather like the anticipated collaboration with the SPARC Gravity wave initiative, some close liaison with the SPARC initiatives for `middle atmospheric water vapour', `ozone trends', and `lower stratospheric chemistry' are anticipated. In all cases the respective groups could examine basic scientific issues whereas GRIPS would concentrate on the modelling aspects, possibly including long-term prediction and making attempts to put error bars on the certainty of the models.
A further proposal for a GRIPS experiment comes from A. Robock and G. Stenchikov. Based on some unpublished model results, they propose investigating the effects of volcanic eruptions on the state of the troposphere. The model study shows that the stratospheric aerosol loading following the Pinatubo eruption in 1991 caused a change in the circulation of the middle atmosphere, supporting a stronger than normal polar vortex in northern winter. This, in turn, is associated with an anomalous tropospheric circulation (see Kodera 1993), with a zonal flow over the Atlantic and western Europe and an extension of the pattern over eastern Asia. The agreement between a number of models on the causality of such effects would greatly support the fact that the middle atmosphere can influence the tropospheric circulation. Interpretation of such experiments would be strongly assisted by the natural links in the models, investigated in Task 1c. Such changes in the tropospheric circulation as a result of initial changes in the stratosphere are also an essential part of the investigations of SPARC and should be considered in a modelling context.
In the longer term, there are clearly a wide range of experiments which would be suitable for GRIPS. While all of these are unlikely to be performed by all groups, the initiative, like SPARC, should attempt to provide a balanced set of results to quantify and limit our interpretation of predictions of the climatic effects of stratospheric change. Clearly, a multi-disciplinary approach will be needed, with contributions from atmospheric chemists, aerosol physicists, and experts on numerical methods, as well as the dynamical meteorologists who have participated in GRIPS until now. There are obvious connections between GRIPS and the other SPARC initiatives, which should intensify during the next few years. The most important objectives for GRIPS are: to provide a base (through annual workshops) for discussion of the problems and their practical solution in the modelling community; to liaise with other international and national model intercomparisons (especially AMIP); to discuss current issues about the compositional change of the atmosphere with the wider community, especially the other SPARC initiatives; and to provide the general scientific community, through SPARC, with a consensus opinion as to how well we can model the climate-middle atmospheric state and how it may be affected by various scenarios of stratospheric change.
Baldwin, M.P., X. Cheng, and T.J. Dunkerton, Observed correlations between winter mean stratospheric and tropospheric circulation anomalies. Geophys. Res. Lett., 21, 1141-1144. 1994.
Gates, W.L., AMIP: the atmospheric model intercomparison project. Bull. Am. Meteorol. Soc., 1962-1970. 1992.
Gibson, J.K., P. Kållberg, S. Uppala, A. Hernandez, A. Nomura and E. Serrano, ECMWF re-analysis project report series, 1: ERA description. ECMWF, Reading, UK,. 1997.
Haynes, P.H., C.J. Marks, M.E. McIntyre, T.G. Shepherd, and K.P. Shine, On the ``Downward Control" of extratropical diabatic circulations by eddy-induced mean zonal forces. J. Atmos. Sci., 48, 651-678. 1991.
Kitoh, A., Koide, H., Kodera, K., Yukimoto, S., and Noda, A., Interannual variability in the stratosphere-troposphere circulation in a coupled ocean-atmosphere GCM. Geophys. Res. Lett., 23, 543-546. 1996.
Langematz, U., and G. Radek, The sensitivity of stratospheric temperatures to the formulation of ozone in the Berlin TSM-GCM. Proc. of the first SPARC general assembly, WMO-WCRP-99, WMO/TD-No. 814, 59-62. 1997.
Luther, F.M, R.G. Ellingson, Y. Fouquart, S. Fels, N.A. Scott, and W.J. Wiscombe, Intercomparison of radiation codes for climate models (ICRCCM): Longwave clear-sky results - a workshop summary. Bull. Am. Meteorol. Soc., 69, 40-48. 1988.
Mechoso, C.R., and A. Kitoh, Simulations of the stratospheric circulation. Proc. of the first AMIP scientific conference, WMO-WCRP-92, WMO/TD-No. 732, 233-238. 1996.
Pawson, S., and M. Fiorino, Intercomparison of reanalyses in the tropical lower stratosphere. Part 1: thermal structure and the annual cycle. Clim. Dyn., 1998.
Pawson, S., and 31 co-authors, Intercomparison of stratospheric models: GRIPS. Proc. of the first SPARC general assembly, WMO-WCRP-99, WMO/TD-No. 814, 59-62. 1997.
Perlwitz, J., and H. Graf, The statistical connection between the tropospheric and stratospheric circulation of the northern hemisphere in winter. J. Clim., 8, 2281-2295. 1995.
Phillips, T., A summary documentation of the AMIP models. PCMDI Report No. 18. 1995.
Randel, W.R., Global atmospheric circulation statistics, 1000-1mb. NCAR technical note, TN-366+STR. 1992.
Schubert, S.D., R.B. Rood, and J. Pfaentner, An assimilated dataset for earth science applications. Bull. Am. Meteorol. Soc., 74, 2331-2342. 1993.
Shine, K.P., Sources and sinks of zonal momentum in the middle atmosphere diagnosed using the diabatic circulation. Q. J. R. Meteorol. Soc., 115, 265-292. 1989.
Swinbank, R., and A. O'Neill, A stratosphere-troposphere data assimilation system. Mon. Weath. Rev., 122, 686-702. 1994.
The GCM-Reality Intercomparison Project for SPARC (GRIPS) provides a framework for analysing and comparing troposphere-stratosphere general circulation model (GCM) simulations. One of the key questions to be addressed by GRIPS is how well comprehensive GCM's simulate the current climate and its variability. To answer this question requires a comprehensive documentation of the stratospheric climate, providing a set of diagnostic variables of use to GRIPS and the broader research community. To that end, the SPARC Reference Climatology group was established to provide an updated climatology of the middle atmosphere based on observations. This data base should include both fundamental and derived meteorological quantities describing the stratospheric climate and its variability.
The scientific aims of the Reference Climatology group are described in this report. These plans are separated into short-range (Phase 1) and long-range (Phase 2) goals. Phase 1 involves compilation of a set of standard diagnostics derived from stratospheric meteorological analyses, and comparisons between different data sources. It will also include tropical wind measurements, mesospheric wind and temperature fields, and climatologies of selected trace constituents. Some possible goals for Phase 2 are described at the end.
Phase 1 of the Reference Climatology work involves compiling a set of global meteorological statistics derived from operational analyses, together with data sets describing tropical wind variability, mesospheric wind and temperature structure, and a climatology of selected trace gases. These are described in turn below.
• Stratospheric meteorological data
This task involves compiling a set of basic quantities describing the zonal mean state of the atmosphere and statistics on stationary eddy fields. The specific quantities to be included are listed in Table 4.4 below (these match the quantities analysed by GRIPS). These statistics will be obtained from long time records of operational stratospheric meteorological analyses and assimilation products. Based on global coverage, the following data sets will be used:
|
|
|
|
|
|
|
|
|
|
|
|
|
|
|
|
|
|
|
|
|
|
|
|
|
|
|
|
|
|
|
|
|
|
U (10 hPa, 60° N/S) T (10 hPa, N/S poles) |
|
Table 4.4. Meteorological parameters to be included in Phase 1
*Interannual variability of these quantities also included
It is recognised that problems exist in the analysis of tropical winds in the above global data sets, particularly for characterising the equatorial quasi-biennial oscillation (QBO). Therefore, monthly mean time series of the near-equatorial zonal winds over 70-10 hPa compiled from rawinsonde observations (Naujokat, 1986, updated through the present time) will be part of the SPARC data base.
Numerical models of the middle atmosphere often extend into the mesosphere, and it is desired to incorporate some characterisation of mesospheric wind and temperature observations into the SPARC Phase 1 data base. Climatological data covering the mesosphere include the COSPAR International Reference Atmosphere CIRA-86 compilation based on satellite temperatures and derived winds (Barnett and Corney, 1985; Fleming et al., 1988), and the empirical model of Hedin et al. (1993), based on satellite, radar and rocketsonde data. A recent reprocessing of the Pressure Modulated Radiometer (PMR) mesospheric data set has made available three years of mesospheric temperatures spanning 1975-1978. Although the original PMR data were included in the CIRA-86 climatology, some differences are apparent in these reprocessed data, and additionally a short record of interannual variability is available
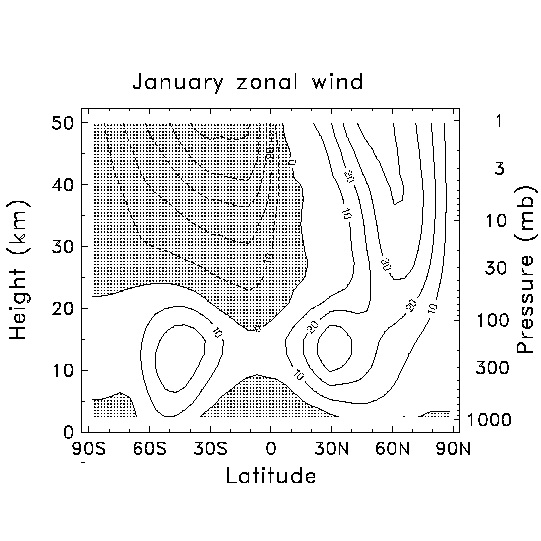
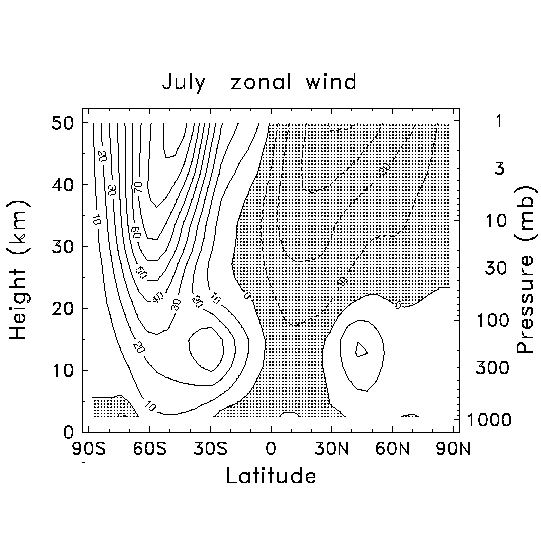
Figure 4.3. Meridional cross section of zonal mean zonal wind in January and July, derived from 18 years of NCEP stratospheric analyses (1979-1996). Contour interval is 10 m/s.
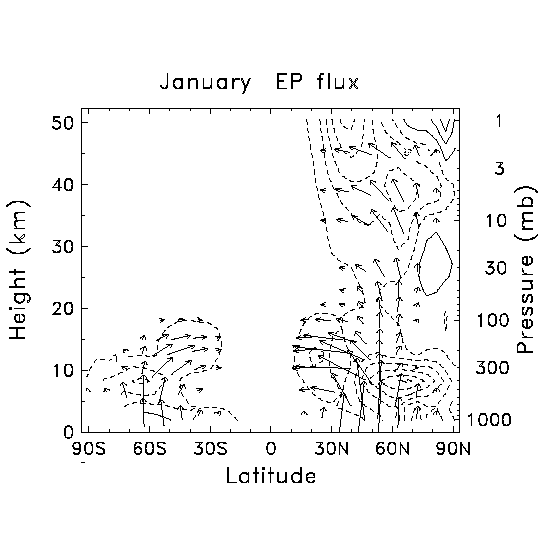
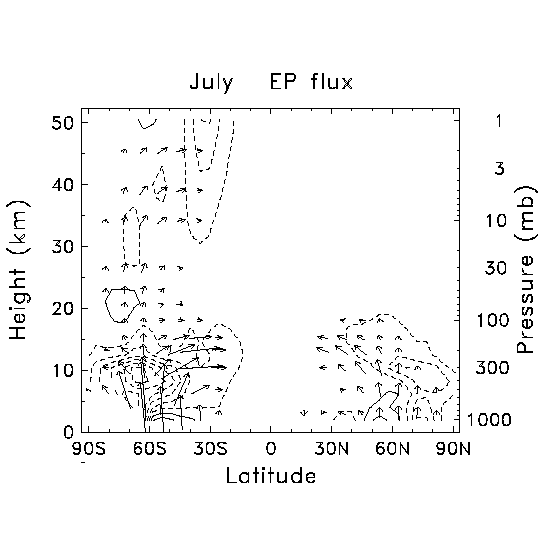
Figure 4.4. Climatological Eliassen-Palm (EP) flux diagram for January and July, derived from NCEP stratospheric analyses over 1979-1996. Vectors denote components of the EP flux, showing the direction and magnitude of wave activity flux in the meridional plane. Contours show the EP flux divergence, associated with eddy forcing of the zonal mean flow. Contours are +/- 1,3,5,...m/s per day.
(Lawrence and Randel, 1996). A novel data set of considerable interest is the zonal wind climatology derived from the High Resolution Doppler Imager (HRDI) instrument on UARS (Burrage et al., 1996; Ortland et al., 1996). These data cover altitudes of approximately 20-40 and 50-110 km, with time series spanning 1992-1996. These data have the advantage of providing direct measurements of tropical winds. Details of which mesospheric data sets to include in the SPARC climatology are a topic of current discussion. We anticipate co-ordinating the SPARC efforts with current revisions of the CIRA climatology.
The SPARC Phase 1 data base will include several trace constituent data sets that are of use and interest in stratospheric modelling. These will include monthly mean climatologies of ozone (O3) and water vapour (H2O), which are important radiatively active constituents, and methane (CH4), which is useful as a long-lived tracer of stratospheric transport. Climatological seasonal cycles of these constituents have been derived from measurements taken by the Halogen Occultation Experiment (HALOE) on the Upper Atmosphere Research Satellite (UARS), augmented in polar regions by ozone data from the Microwave Limb Sounder (MLS) and methane observations from the Cryogenic Limb Array Etalon Spectrometer (CLAES) (both on UARS). These seasonal cycles are derived from harmonic regression analyses of UARS data spanning 1991-1997 (Randel et al., 1997). Examples of these data sets are shown in figure 4.5. Further constituents will be added in the future, and we plan to co-ordinate our efforts with a UARS climatology group.
An important part for Phase 1 will be to make systematic comparisons of the circulation statistics derived from the independent meteorological data sets. Such comparisons will highlight uncertainties in these data sets, particularly for the more highly derived quantities. Figure 4.2 shows an example comparison, showing differences in temperature at the North and South Poles between the UKMO and NCEP data. Systematic differences of order 2-4K (and larger) are found, which vary seasonally and repeat from year to year. Such comparisons will point to areas in the analyses that require future improvement.
Click here to download Figure 4.5 by anonymous ftp (164 Ko).
Figure 4.5. Meridional cross sections of ozone (left) and methane (right) during January (top) and July (bottom) from the seasonal climatologies derived from HALOE, MLS and CLAES data.
The compilation of circulation statistics from the meteorological data to be used in Phase 1 is currently underway (the NCEP statistics have already been transferred to the GRIPS group). Details of the data archive and access to the research community is a topic of current discussion. One possible plan is for the establishment of a SPARC Data Centre, which would handle the SPARC Reference Climatology archive along with data sets from other SPARC initiatives. Detailed comparisons of the data sets and a compilation of circulation statistics will appear as a SPARC Technical Report, along with a summary publication in the refereed literature.
Research topics of interest include obtaining better climatologies of tropical winds and updating our knowledge of the QBO, and improved data sets in the mesosphere (combining historical rocketsonde, lidar, and satellite data sets). Phase 2 data may include more highly derived quantities that link with the GRIPS initiatives to study troposphere-stratosphere statistical connections, diagnostics of sudden warmings, and space-time spectra of travelling atmospheric waves.
Timeline
1998/1999 - establishment of SPARC data centre
- compilation of Phase I data sets
- begin detailed intercomparisons
1999/2000 - continued intercomparisons
- publish SPARC technical report
- phase 2 (collaboration with GRIPS)
Figure 4.6. Differences in temperature between UKMO and NCEP data sets at the North Pole (top) and South Pole (bottom) during 1991-96. Note the systematic bias patterns that repeat each year.
Barnett, J.J., and M. Corney, 1985: Middle atmosphere reference model derived from satellite data. Middle Atmosphere Program MAP Handbook 16, 47-85.
Burrage, M.D., et al., 1996: Validation of mesosphere and lower thermosphere winds from the high resolution Doppler imager/UARS. J. Geophys. Res., 101, 10365-10392.
Coy, L. and R. Swinbank, 1997: The characteristics of stratospheric winds and temperatures produced by data assimilation. J. Geophys. Res., D22, p. 25763.
Finger, F.G., et al., 1993: Evaluation of NMC upper stratospheric temperature analyses using rocketsonde and lidar data. Bull. Am. Meteor. Soc., 74, 789-799.
Fleming, E.L., S. Chandra, M.R. Schoeberl and J.J. Barnett, 1988: Monthly mean global climatology of temperature, wind, geopotential height and pressure for 0-120 km. NASA Tech. Memo., NASA TM-100697, 85 pp.
Gelman, M.E., et al., 1986: Detection of long-term trends in global stratospheric temperature from NMC analyses derived from NOAA satellite data. Adv. Sp. Res., 6, 17-26.
Hedin, A.E., E.L. Fleming, A.H. Manson, P.J. Schmidlin, S.K. Avery and S.J. Franke, 1993: Empirical wind model for the middle and lower atmosphere, 1, Local time average. NASA Tech. Memo., NASA TM-104581, 85 pp.
Lawrence, B.N., and W.J. Randel, 1996: Variability in the mesosphere observed by the Nimbus 6 pressure modulated radiometer. J. Geophys. Res., 101, 23475-23489.
Naujokat, B., 1986: An update of the observed quasi-biennial oscillation of the stratospheric winds over the tropics. J. Atmos. Sci., 43, 1873-1877.
Ortland, D.A., W.R. Skinner, P.B. Hays, M.D. Burrage, R.S. Lieberman, A.R Marshall and D.A. Gell, 1996: Measurements of stratospheric winds by the high resolution Doppler imager. J. Geophys. Res., 101, 10351-10363.
Randel, W.J., F. Wu, J.M. Russell III, A. Roche and J.Waters, 1997: Seasonal cycles and QBO variations in stratospheric CH4 and H2O observed in UARS HALOE data J. Atmos. Sci., in press.
Randel, W.J., 1992: Global Atmospheric Circulation statistics 1000-1 mb. NCAR Technical Note, NCAR/TN-366+STR, 256 pp.
Swinbank, R., and A. O'Neill, 1994: A stratosphere-troposphere data assimilation system. Mon. Weal Rev., 122, 686-702.
The quasi-biennial oscillation (QBO) is an east-west oscillation in stratospheric winds characterized by an irregular period averaging 28 months. In the equatorial region where the QBO is dominant, easterlies are typically 30 ms_1 and westerlies near 20 ms-1. The QBO is seen between 100 hPa and 2 hPa, with a maximum amplitude near 10 hPa (Hamilton, 1981). Figure 4.7 (Marquardt and Naujokat, 1996) is an update of B. Naujokat’s equatorial time/height cross section based on radiosonde observations from stations near the equator. (For a given month the data are taken from one station only.) The equatorial winds are dominated by alternating easterly and westerly wind regimes, with a period varying from 22 to 36 months. These wind regimes propagate irregularly downward, with easterly shear zones tending to propagate more slowly and to be less irregular. The QBO may also be seen in temperature, and it dominates the interannual variability of total ozone in the tropics.
Although the amplitude of the QBO decreases rapidly away from the equator, observations and theory show that the QBO affects a much larger region of the atmosphere. Through wave coupling, the QBO affects the extra-tropical stratosphere during the winter season, especially in the northern hemisphere where planetary wave amplitudes are large. These effects also appear in constituents such as ozone. In the high-latitude northern winter, the QBO’s modulation of the polar vortex may affect the troposphere through downward penetration. Tropical tropospheric observations show intriguing quasi-biennial signals which may be related to the stratospheric QBO. The QBO has been linked to variability in the upper stratosphere, mesosphere, and ionospheric F layer.
In equatorial regions it is very difficult to drive zonal mean temperature and wind oscillations by thermal forcing alone (Andrews et al., 1987). As proposed by Lindzen and Holton (1968) and Holton and Lindzen (1972), the QBO is understood to be driven by the
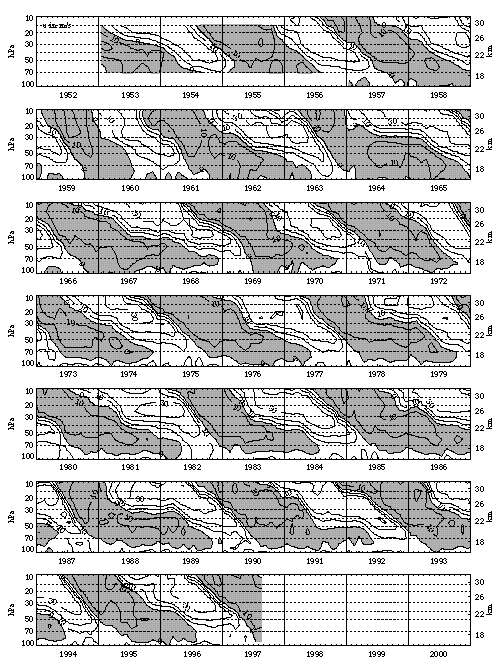
Figure 4.7. Time-height section of zonal wind at equatorial stations. Isopleths are in meters per second. The data are from Canton Island (January, 1953 to August, 1967), Canton Island (September, 1967 to December, 1975), Gan/Maldive Islands (January, 1976 to April, 1985), and Singapore (May, 1985 to August, 1997). (From B. Naujokat, with permission.)
vertical transfer of momentum by waves having their source in the troposphere. In theory, Kelvin waves (which provide westerly momentum) and Rossby-gravity waves (which provide an easterly acceleration) could account for the observed quasi-biennial periodicity, zonally symmetric westerlies at the equator, and downward propagation without loss of amplitude (Holton and Lindzen, 1972). However, observations show that Rossby-gravity wave amplitudes are too small to drive a QBO of the observed amplitude and period, especially when equatorial upwelling by the Brewer-Dobson circulation is considered. It now appears that a broad spectrum of vertically propagating gravity waves is also essential for driving the QBO (Dunkerton, 1997; Sato and Dunkerton, 1997).
The QBO has been simulated using 2-d and 3-d models, but only recently (Takahashi, 1996; Horinouchi and Yoden, 1997) has the possibility of the spontaneous generation of a QBO in a GCM been realized. The generation of a QBO in a GCM raises some fundamental questions. For example, why don’t other GCMs spontaneously generate a QBO? What would be required for the model(s) to generate a more realistic oscillation? The variable period of the QBO raises additional questions which may be solved through modeling, e.g., are sea-surface temperature effects on waves (Geller et al., 1997) a factor, or possibly interannual variation of the residual mean meridional circulation?
Although the QBO is observed to be confined to within about 25° of the equator, its effects extend throughout the stratosphere (Holton and Tan, 1980; Naito and Hirota, 1997). Coupling to the extra-tropical stratosphere is understood to depend on the modulation of planetary-scale waves. During the winter season, when stratospheric winds are strong and westerly, planetary scale waves propagate upward from the troposphere and are refracted equatorward in the stratosphere, depending on the structure of the zonal mean wind field. By modulating the direction and reflection/absorption of the planetary-scale waves, the QBO induces a remote effect at high latitudes in winter, especially in the northern hemisphere where planetary-scale waves are largest. The effect of the annual cycle of planetary wave propagation, together with the QBO’s effect, is observed to modulate dynamical quantities (temperature, winds, wave amplitudes, potential vorticity) (Baldwin and Dunkerton, 1997; Randel et al., 1997) as well as chemical constituents such as ozone (Randel and Cobb, 1994; Tung and Yang, 1994), nitrogen dioxide (Zawodny and McCormick, 1991), aerosols (Hitchman et al., 1994), water vapor and methane (Gray et al., 1997). The QBO’s influence is seen in subtropical ozone variability during the winter-spring season in both hemispheres.
Effects of the QBO may also be seen at the stratopause (Dunkerton and Delisi, 1997), where the descending westerly phases of the stratopause semi-annual oscillation are strongly influenced by the underlying QBO. Near the mesopause, observations show a well-defined QBO (Burrage et al., 1996), which may be driven by the selective filtering of small-scale gravity waves by the underlying winds they traverse. Chen (1992) documented a statistical link between the phase of the QBO and the ionospheric equatorial ionization anomaly (EIA). He proposed a mechanism in which planetary waves modulate the tidal wind, and by means of the dynamo effect, change electric fields in the E region, which can be transferred to the F region along geomagnetic field lines to cause variations in the EIA.
The QBO’s effects on the troposphere are suggestive, but are not well understood. Gray (1984) has demonstrated an intriguing and significant link between the phase of the QBO and hurricane formation. The equatorial troposphere shows variability on the time scale of the QBO, but a direct link to the stratospheric QBO has not been established. The reality of the link is being debated (Trenberth, 1980; Xu, 1992; Yasunari, 1989). It is possible that the QBO may influence the high-latitude northern troposphere through its effect on the stratospheric polar vortex. Coupling between stratospheric zonal mean wind and the mid-tropospheric North Atlantic Oscillation is strong (Baldwin et al., 1994), but the cause and effect are not clear. It is possible that QBO-induced high-latitude wind anomalies penetrate downward into the troposphere.
SPARC plans to hold a workshop to address the topics described above in early 1998. The purpose of the workshop is to:
Andrews, D.G., J.R. Holton, and C.B. Leovy "Middle Atmosphere Dynamics." Academic Press, New York, 1987.
Baldwin, M.P., X. Cheng, and T.J. Dunkerton, Observed correlation between winter-mean tropospheric and stratospheric anomalies, Geophys. Res. Lett., 21, 114?1144, 1994.
Baldwin. M.P., and T.J. Dunkerton, Biennial, quasi-biennial, and decadal oscillations of potential vorticity in the northern stratosphere, J. Geophys. Res., in press, 1997.
Burrage, M.D., R.A. Vincent, H.G. Mayr, W.R. Skinner, N.F. Arnold, and P.B. Hays, Long-term variability in the equatorial middle atmosphere, J. Geophys. Res., 101, 12847?12854, 1996.
Chen, P.-R., Evidence for the ionospheric response to the QBO, Geophys. Res. Lett., 19, 1089?1092, 1992.
Dunkerton, T.J., The role of gravity waves in the quasi-biennial oscillation, J. Geophys. Res, in press, 1997.
Dunkerton, T.J., and D.P. Delisi, Interaction of the quasi-biennial oscillation and stratopause semiannual oscillation, J. Geophys. Res., in press, 1997.
Geller, M.A., W. Shen, M. Zhang, and W.W. Tan. Calculations of the stratospheric QBO for time-varying wave forcing. J. Atmos. Sci., 54, 883?894, 1997.
Gray, L.J., R.J. Kennaugh, S.L. Ruth, D.R. Jackson, and J.M. Russell III, Interannual variability of trace gases in the subtropical winter stratosphere, J. Atmos. Sci., submitted, 1997.
Gray, W.M., Atlantic seasonal hurricane frequency. Part I: El Niño and 30 mb quasi-biennial oscillation influences, Mon. Wea. Rev., 112, 1649?1668, 1984.
Hamilton, K., The vertical structure of the quasi-biennial oscillation: Observations and theory, Atmos. Ocean, 19, 236-250, 1981
Hitchman, M.H., M. McKay, and C.R. Trepte, A climatology of stratospheric aerosol, J. Geophys. Res., 99, 20689?20700, 1994.
Holton, J.R., and R.S. Lindzen, An updated theory for the quasi-biennial cycle of the tropical stratosphere. J. Atmos. Sci., 29, 1076?1080, 1972.
Holton, J.R., and H.-C. Tan, The influence of the equatorial quasi-biennial oscillation on the global circulation at 50 mb, J. Atmos. Sci., 37, 2200?2208, 1980.
Horinouchi, T., and S. Yoden, Wave mean flow interaction associated with a QBO-like oscillation in a simplified GCM, J. Atmos. Sci., in press, 1997.
Lindzen, R.S., and J.R. Holton, A theory of the quasi-biennial oscillation. J. Atmos. Sci, 25, 1095?1107, 1968.
Marquardt, C., and B. Naujokat, An update of the equatorial QBO and its variability, in Extended Abstracts of the First SPARC General Assembly, Melbourne, Australia, December 2?6, 1996.
Naito, Y., and I. Hirota, Interannual variability of the northern winter stratospheric circulation related to the QBO and the solar cycle, J. Meteor. Soc. Jpn., 75, 925?937, 1997.
Randel, W.J., and J.B. Cobb, Coherent variations of monthly mean total ozone and lower stratospheric temperature. J. Geophys. Res., 99, 5433-5447, 1994.
Randel, W.J., F. Wu, R. Swinbank, J. Nash, and A. O’Neill, Global QBO circulation derived from UKMO stratospheric analyses, J. Atmos. Sci., submitted, 1997.
Sato, K., and T.J. Dunkerton, Estimates of momentum flux associated with equatorial Kelvin and gravity waves, J. Geophys. Res., CADRE issue, in press, 1997.
Takahashi, M., Simulation of the stratospheric quasi-biennial oscillation using a general circulation model, Geophys. Res. Lett., 23, 661?664, 1996.
Trenberth, K.E., 1980: Atmospheric quasi-biennial oscillations. Mon. Wea. Rev., 188, 1370-1377.
Tung, K.-K., and H. Yang, Global QBO in circulation and ozone, Part I: Reexamination of observational evidence, J. Atmos. Sci., 51, 2699?2707, 1994.
Xu, J., On the relationship between the stratospheric quasi-biennial oscillation and the tropospheric southern oscillation, J. Atmos. Sci., 49, 725?734, 1992.
Yasunari, T, A possible link of the QBOs between the stratosphere, troposphere and sea surface temperature in the tropics. J. Met. Soc. Japan, 67, 483?493, 1989.
Zawodny, J.M., and M.P. McCormick, Stratospheric Aerosol and Gas Experiment II measurements of the quasi-biennial oscillation in ozone and nitrogen dioxide, J. Geophys. Res., 96, 9371?9377, 1991.
It is clear that the changes in stratospheric ozone, which have occurred over the last twenty years (described in section 2.2), have been an important forcing of climate change. They have led to significant changes in the temperature of the lower stratosphere (described in section 2.4) and the troposphere. Major volcanic eruptions occasionally cause large enhancements to the stratospheric aerosol layer, leading to large but relatively short-lived (one to three years) climate anomalies (figure 4.9). The recent scientific assessment of climate change by the IPCC (1996) concluded that both stratospheric ozone decreases and volcanic aerosol increases over the last two decades have a negative radiative forcing impact on surface climate, which, on a decadal time scale, is likely to be smaller than the positive radiative forcing due to increasing greenhouse gases (figure 4.8). Changes in the intensity of solar radiation at the top of the atmosphere during a solar cycle may also have a small but important effect on climate, either directly or through their impact on the stratospheric ozone distribution.
In order to be able to better simulate the observed climate variations during the twentieth century and to assess the relative impacts of different forcing processes, there is an urgent need for reliable estimates of the time variations of these stratospheric aspects of climate forcing. A SPARC working group has been established to review and consolidate the available estimates of observed variations of the ozone distribution, stratospheric volcanic aerosols and solar radiation. These will be used to generate best estimates of the time variations over the last 100 years of the solar constant and the distributions of ozone and stratospheric aerosols. Data sets of these time variations will be made available to the climate modelling community for model simulations of the impact of stratospheric forcing variations on climate.
The working group will co-ordinate closely with other international activities, such as those linked to the WCRP Working Group on Coupled Modelling, which are developing related data sets on time variations of greenhouse gas concentrations and of distributions of tropospheric aerosols. It is likely that the stratospheric climate forcing data sets will be used in climate model intercomparisons co-ordinated by groups such as GRIPS (SPARC), WGCM (CLIVAR) and AMIP (PCMDI), and will be used in future scientific assessments of climate change by the IPCC.

Figure 4.8. Estimates of the globally and annually averaged anthropogenic radiative forcing (in Wm-2) due to changes in concentrations of greenhouse gases and aerosols from pre-industrial times to the present day and to natural changes in solar output from 1850 to the present day. The height of the rectangular bar indicates a mid-range estimate of the forcing whilst the error bars show an estimate of the uncertainty range, based largely on the spread of published values. The forcing associated with stratospheric aerosols is not shown, as it is very variable over this time period. Note that there are substantial differences in the geographical distribution of the forcing due to the well-mixed greenhouse gases (CO2, N2O, CH4 and the halocarbons) and that due to ozone and aerosols, which could lead to significant differences in their respective global and regional climate responses. For this reason, the negative radiative forcing due to aerosols should not necessarily be regarded as an offset against the greenhouse gas forcing. (Figure 2.16 from Climate Change 1995, 2nd Assessment report of the IPCC. 1996)

Figure 4.9. (a) Variation of global mean visible optical depth, and the consequent radiative forcing (Wm-2) resulting from stratospheric aerosols of volcanic origin from 1850 to 1993, as estimated by Sato et al. (1993). The radiative forcing has been estimated using the simple relationship given in Lacis et al. (1992) where the radiative forcing is -30 times the visible optical depth. (b) variation of visible optical depth from the ice core volcanic index of Robock and Free (1995) for 1850 to 1985. The Robock and Free (1995) index has been normalised so that their Northern hemisphere mean agrees with the Sato et al. Northern hemisphere optical depth for the mid-1880 Krakatau peak. Since Robock and Free's analysis is largely based on high latitude measurements, it is not likely to be representative of the global mean.
(figure 2.15 from Climate Change 1995, 2nd Assessment report of the IPCC. 1996)
Climate Change 1995. Eds. J.T.Houghton, L.G.Meira Filho, B.A.Callander, E.Haites, N.Harris, A.Kattenberg, and K.Maskell, Intergovernmental Panel on Climate Change (IPCC), Cambridge University Press, 1996.
Lacis, A., J.Hansen and M.Sato, Climate forcing by changes in the vertical distribution of ozone, Journal of Geophysical Research, 19, 1607-1610. 1992.
Robock,A., and M.P.Free, Ice cores as an index of global volcanism from 1850 to the present, Journal of Geophysical Research, 100, 1154911568. 1995.
Sato, M., J.E.Hansen, M.P.McCormick and J.B.Pollack, Stratospheric aerosol optical depths, 1850-1990. Journal of Geophysical Research, 98, 22987-22994. 1993.
The modelling of the thermal and dynamical state of the stratosphere is an extremely important activity both for understanding the processes that contribute to the present state and for predictions of the state in the future. There are considerable uncertainties at present in the evaluation of the `natural' variability of the stratosphere and in model simulations of present-day basic state as compared to observations. Most models are `tuned' to agree with observations which raises the question of whether the model-simulated responses to changes in composition are realistic. Additionally, model studies have to be continued to study the mechanisms contributing to the responses in the case of the following perturbations: Effects of changes in composition - long-term (trace gases) and transient (volcanic aerosols);Influence due to changes in troposphere - aerosols, trace gases, clouds; Influence due to dynamical changes in the troposphere; Solar irradiance variations and the associated chemical-dynamical feedback.
The four SPARC activities described in this chapter aim at complementing existing gaps in current international research activities in climate modelling. The SPARC intercomparison of troposphere-stratosphere general circulation models has proved to be a fruitful activity, bringing together most of the research teams who work with such models in workshops. This activity will not only improve confidence in these models over time, many experiments being planned for the next few years, but has also provided a means of communication and interaction between these working groups. The SPARC reference climatology, available in the near future, will help such model intercomparisons by providing a coherent working base with which to initialise and compare models.
An assessment of understanding of the quasi-biennial oscillation, is hoped to be obtained through the workshop to be held in 1998 on this issue. The SPARC SSG will subsequently decide whether research on dynamical variability needs to be complemented by further SPARC activities.
A data base of the best estimates of parameters which determine stratospheric aspects of changes in climate forcing since 1880 will be compiled by an ad hoc SPARC committee and available as a SPARC report end of 1998. This will provide much needed data for the climate modelling community and will be used as input for the following IPCC assessment on climate change.
![]()