Table 1 lists the percentage differences, (Uncorrected ö corrected)*100/corrected, for each UV correction, for the erythemally-weighted irradiance corresponding to the scan around local noon on the 30th May 1999 for data at the four sites. In addition, Table 1 lists the range of percentage differences for all UV corrections, of daily-integrated DUV values for available data at the four sites. In this additional part of the table, the positive values for Boulder and Rocky are due to very low temperatures during the UV measurements. For example, at Boulder on the 12th January 1997, the PMT temperature of the Brewer ranged from ö16 to ö10 ° C. The positive values for RTP were due to large values of stray light entering the PMT.
TABLE 1
|
|
|
|
|
|
|
|
|
|
|
|
|
|
|
|
|
|
|
|
|
|
|
|
|
|
|
|
|
|
|
|
|
|
|
|
|
|
|
|
|
|
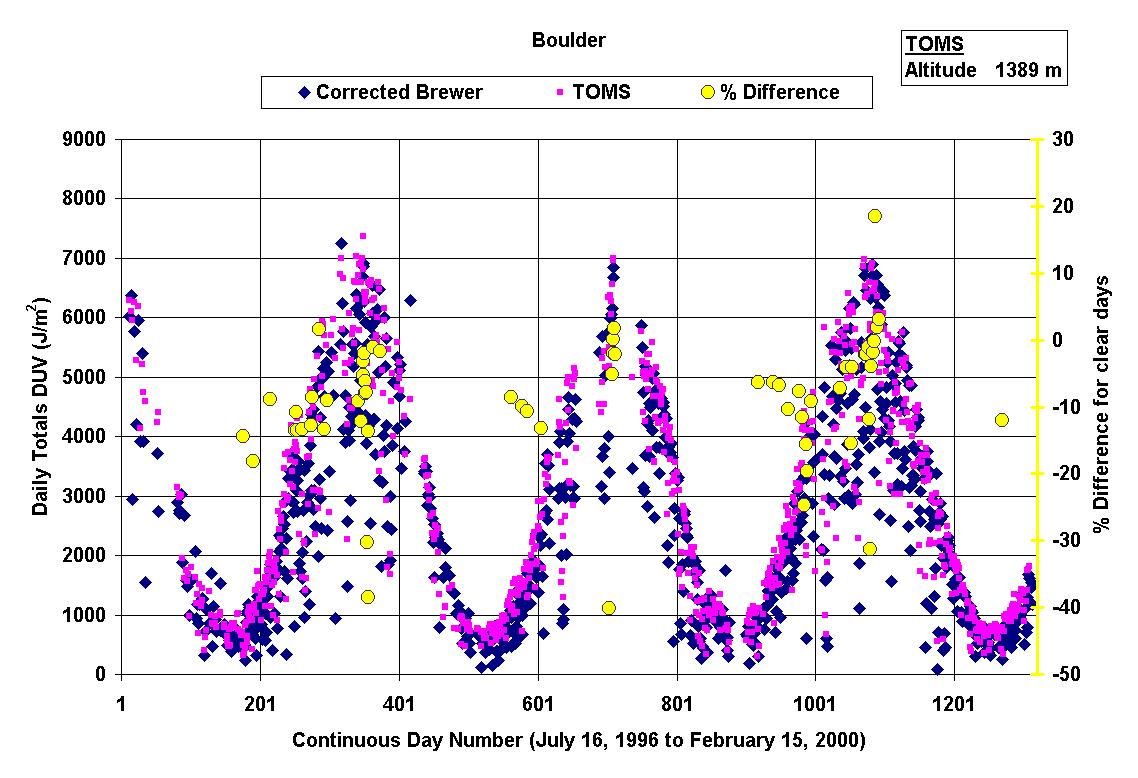
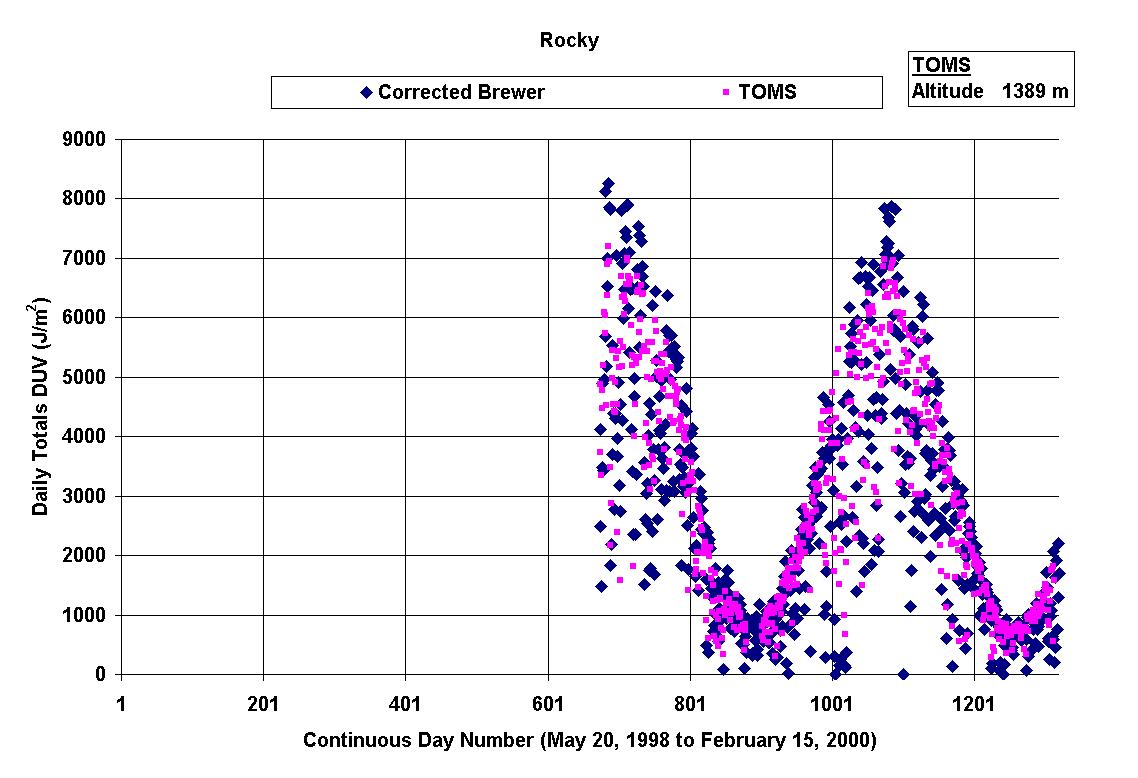
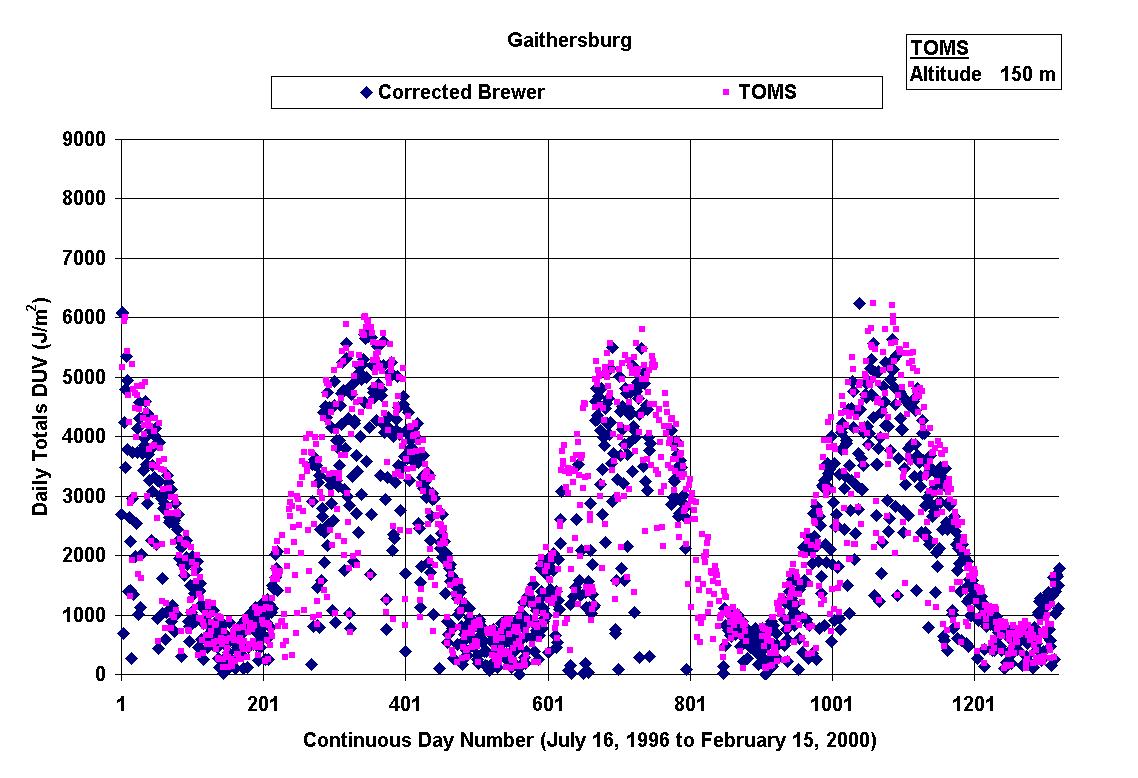
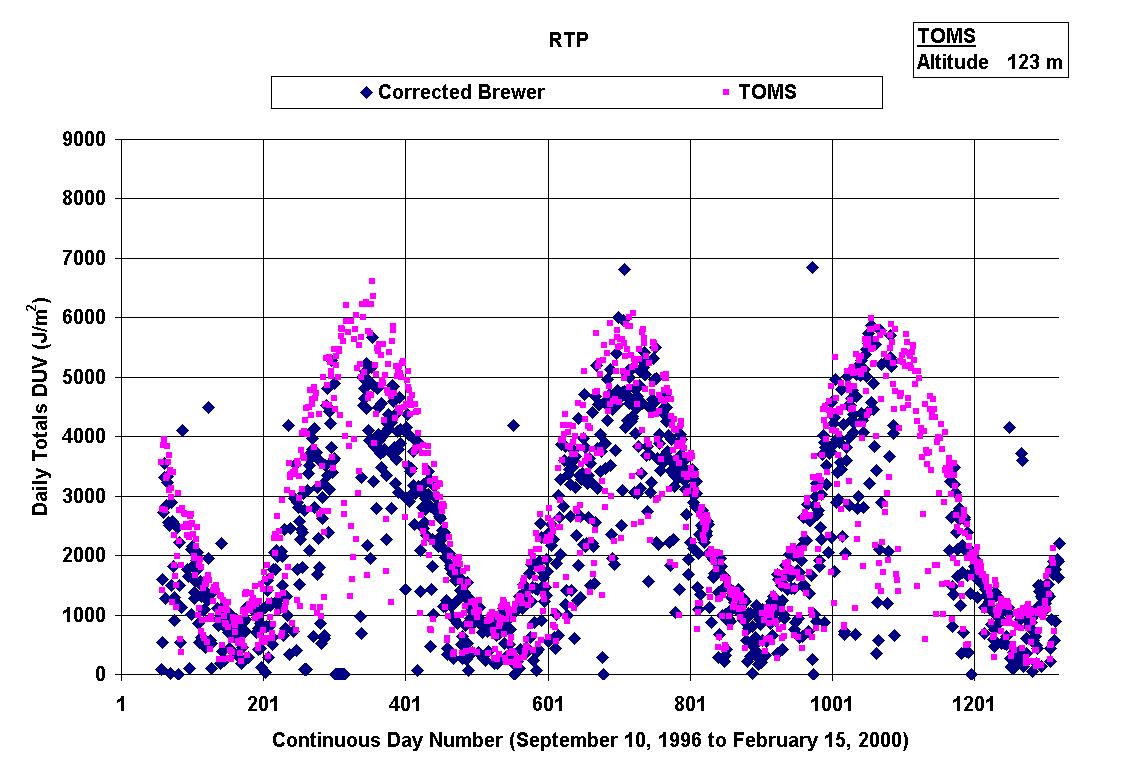
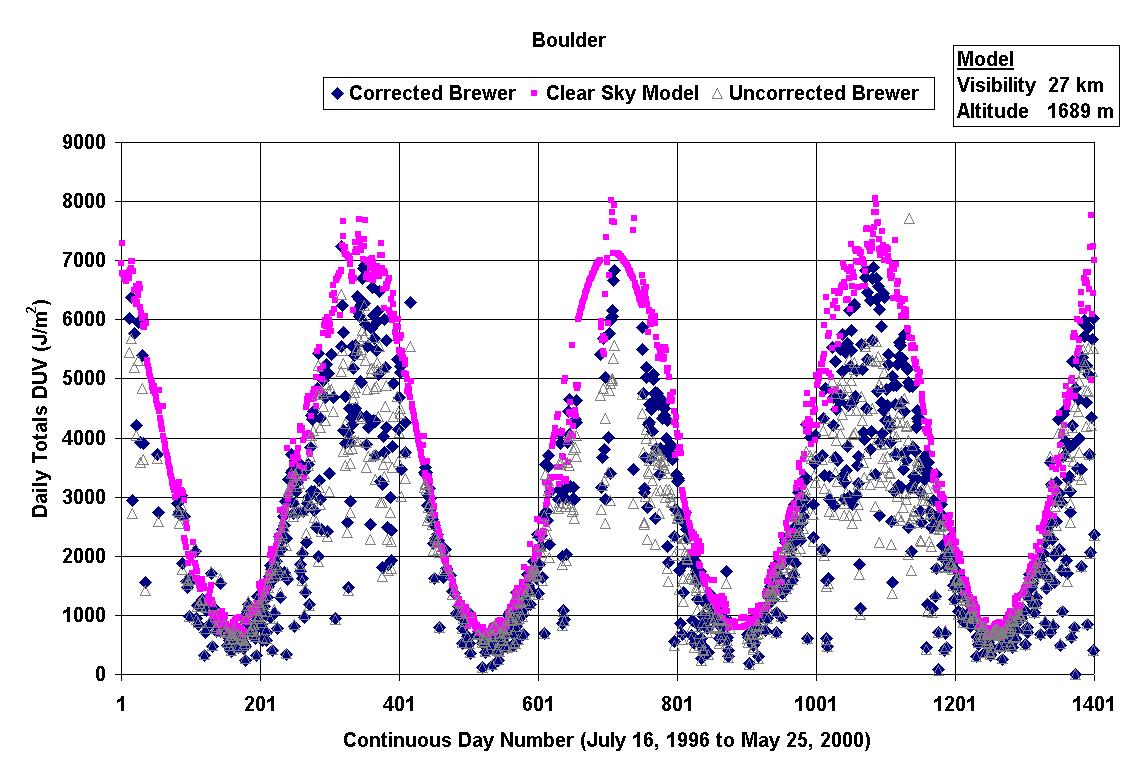
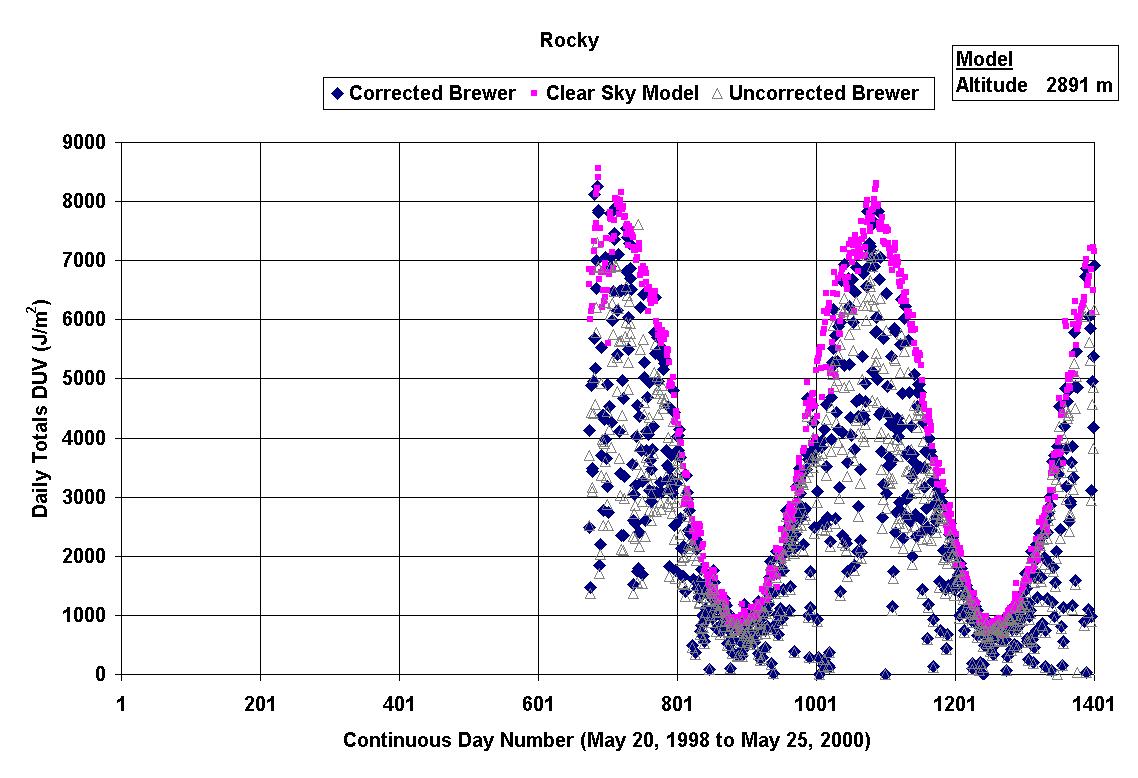
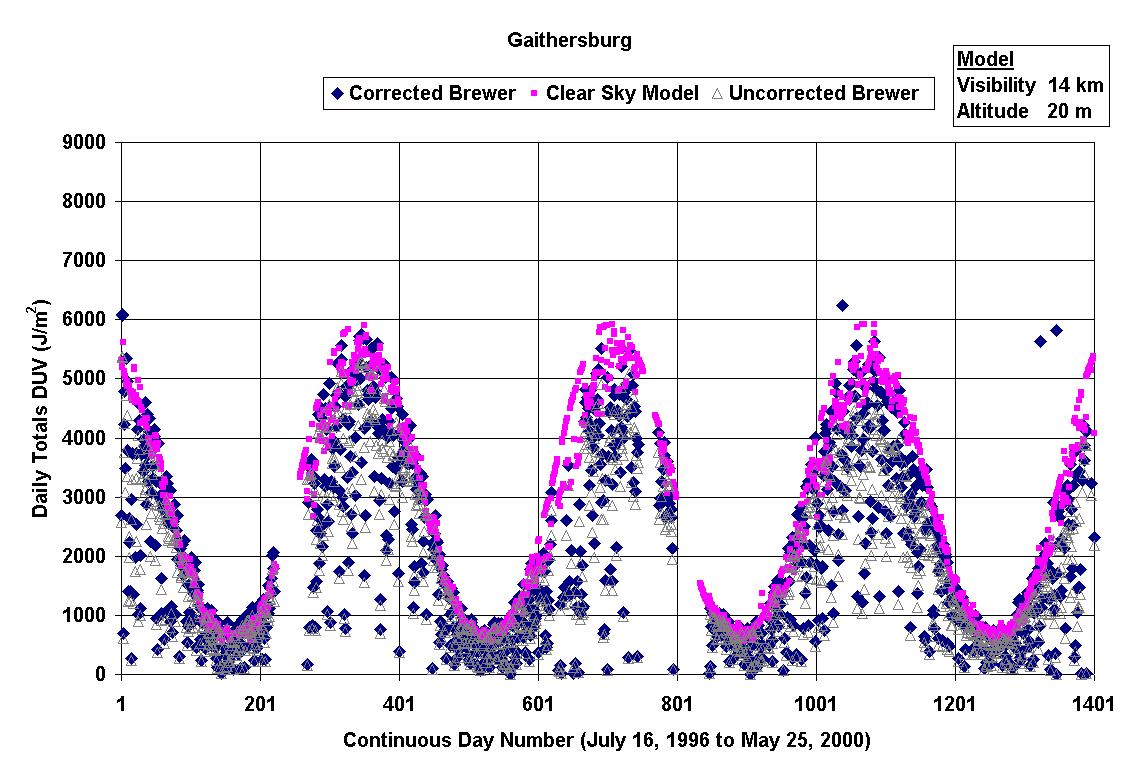
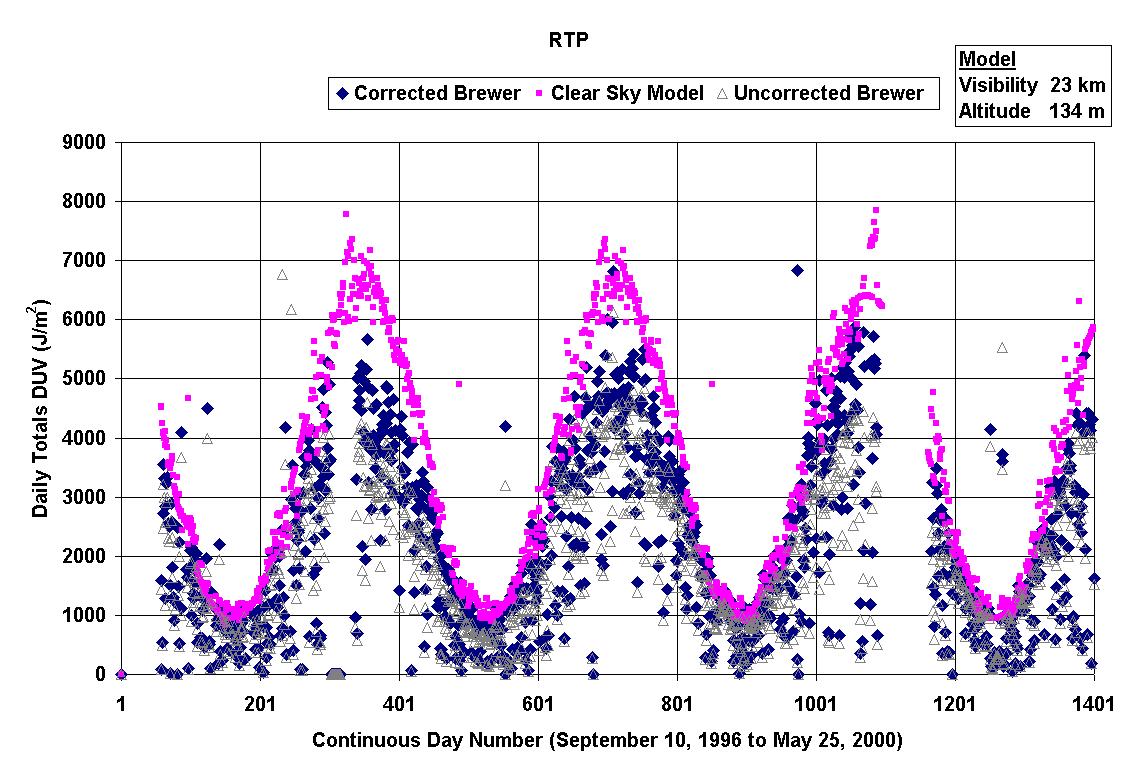
Figure 1 presents a graph of the uncorrected, corrected and clear-sky model data for (a) Boulder (b) Rocky (c) Gaithersburg and (d) RTP.
(a)
(b)
(c)
(d)
Figure 1. Graphs showing the daily DUV levels for (a) Brewer # 101 (b) # 146 (c) # 105 and (d) # 087, compared to the corresponding clear-sky modeled data for the dates as shown on the x-axes.
The corrections bring the measured DUV in closer agreement with the clear sky modeled calculations.
Figure 2 shows an example correlation graph of clear-sky, uncorrected and corrected DUV data versus clear-sky modeled data for Boulder. Clear-skies are defined as days for which the corresponding TOMS reflectivity data was less than 5 %. Only data where a full day of UV scans and measured Brewer ozone data were available are presented and used for analysis purposes. A linear correlation is shown for both the corrected and uncorrected Brewer DUV data with respect to the modeled data.
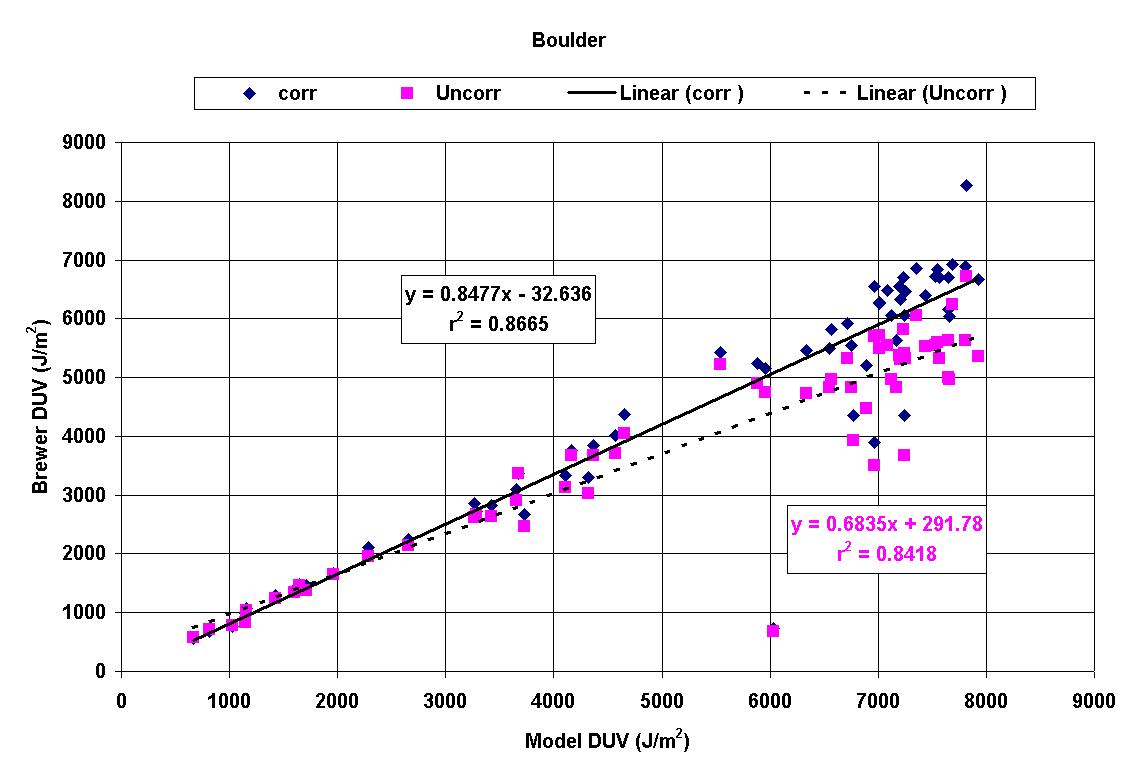
Figure 2. Graph showing daily, clear-sky Brewer DUV data versus clear-sky model data. The linear correlation and information box shown at the top of the graph corresponds to the corrected Brewer data.
The clear-sky corrected data show improvement in the correlation coefficient and are in better agreement with model clear-sky calculations, but they still fall below the model DUV values by approximately 15 %.
Figure 3 shows a time series graph corresponding to Figure 2, for corrected and model data only. The differences between the corrected and modeled data, (Corrected ö Model)*100/Model, is ö 44.1 to 5.7 %, with an average difference of ö 14.5 %. The larger values of the model calculation is in part due to the fact that some clear days, defined by TOMS overpass data at approximately 11:15 AM local time, may not remain clear throughout the whole day. In addition, the UVSPEC model may overestimate the irradiance because the optical depth and ozone were held constant throughout the day.
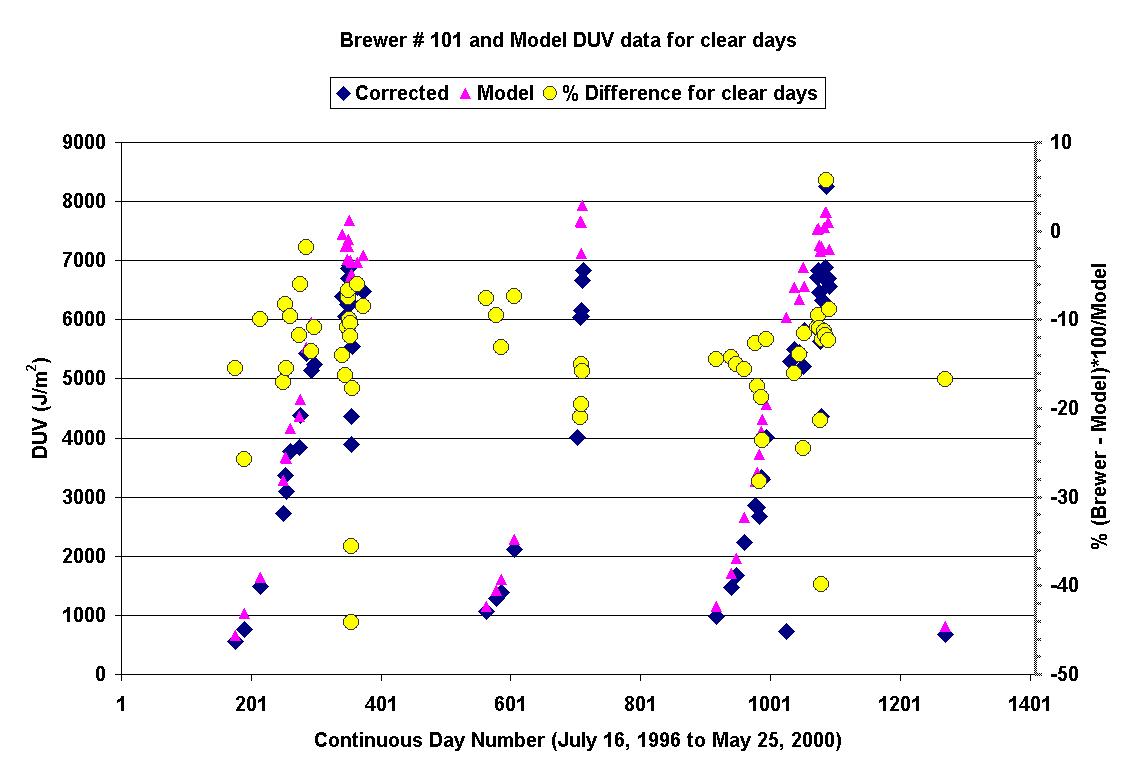
Figure 3. Graph showing clear-sky daily DUV levels for Brewer # 101 compared to the clear-sky modeled data.