Corrected UV irradiances from the U.S. EPA/UGA network of Brewer
spectroradiometers and comparisons of DUV values with satellite
data
J. Sabburg, J.E. Rives, T. Taylor, G. Schmalzle, S. Zheng, N.
Huang, A. Wilson, and R.S. Meltzer
National UV Monitoring Center, Department of Physics and Astronomy,
University of Georgia, Athens, GA 30602 USA
P.M. Udelhofen
Institute for Terrestrial and Planetary Atmospheres, State University
of New York, Stony Brook, NY 11794-5000
FIGURES
Abstract
A network of 21 Brewer spectroradiometers, operated by the U.S.
Environmental Protection Agency/University of Georgia (EPA/UGA)
is measuring UV spectral irradiances throughout the United States.
Corrections to the raw data have now been implemented. These corrections
include (1) the cosine errors associated with the full sky diffuser,
(2) the temperature dependence of the response of the instruments
and (3) the temporal variation in the instrument response due
to optical changes in the characteristics of the instruments.
While for many sites the total corrections amount to less than
10 %, for certain sites they are much larger, in some cases amounting
to more than 25 %. Application of these corrections brings the
errors of the absolute irradiance values to approximately ± 5 %.
Introduction
A network of 21 Brewer MKIV spectroradiometers (Kipp & Zonen Inc,
Canada) is measuring UV spectral irradiances throughout the United
States. The database from these sites extends for periods ranging
from two to seven years.
Corrections to the raw data have now been implemented. These corrections
include (1) the cosine errors associated with the full sky diffuser,
(2) the temperature dependence of the response of the instruments
and (3) the temporal variation in the instrument response due
to optical changes in the characteristics of the instruments.
The dark count, dead time and stray light corrections of the program
RD_UX and the UVA correction and erythemal action spectrum used
in the latest version of the program UVSUM, were also used for
this paper (Sci-Tec 1999). When referring to the uncorrected UV
data it is implied that dark-count, dead time and the UVA correction
have been applied.
Corrected irradiances at four sites are compared with a clear
sky UV model. These sites are Boulder (#101, 40.12 ° N, 105.24 ° W, 1689 m a.s.l.), Rocky Mountain (#146, 40.03 ° N, 105.53 ° W, 2891 m a.s.l.), Gaithersburg (#105, 39.08 ° N, 77.22 ° W, 20 m a.s.l.) and Research Triangle Park (RTP) (#087, 35.89
° N, 78.88 ° W, 134 m a.s.l.). Details of these sites are available at the
EPA web address: http://www.epa.gov/uvnet/
Intercomparisons of the daily-integrated damaging UV (DUV) measurements
from the Brewers at these sites to DUV values inferred from satellite
overpass data, corresponding to these sites, are made in order
to validate the estimates from the satellite data. Available satellite
data ranges from July 1996 until February 2000. Brewer and model
DUV data will be presented from July 1996 until May 2000.
It should be noted that the erythemally-weighted irradiances for
the Brewer, model and TOMS data all used the action spectrum of
McKinlay and Diffey (1987).
Instrumentation and methodology
- Brewer Spectroradiometer
To measure UV irradiance the Brewer uses a quartz dome and Teflon
diffuser with a hemispherical field of view. For the EPA/UGA network,
a dynamic schedule is used by the Brewer allowing UV readings
to be recorded approximately every 30 minutes throughout the day,
ensuring that a UV scan coincides with solar noon. The Brewer
has a UV spectral range of 286.5 to 363 nm in 0.5 nm steps. UV
irradiance calibrations, using a secondary standard lamp traceable
to a NIST 1000 W lamp, are performed at the sites by NUVMC. Resulting
response functions were used to calculate irradiance from photon
counts. Calibrations are targeted to occur once per year. In addition
independent quality assurance audits of the instruments take place.
The Brewer recorded total column ozone levels between UV measurements.
The methodology of Sabburg et al. (2000) was used to obtain direct sun ozone values to less than
± 3 %.
- UV Corrections
The data presented in this paper have been corrected for dark
count, dead time, stray light, UVA, cosine response, temperature
dependence and temporal response. Only limited quality assurance
(QA) has been performed on the raw data, such as removing extreme
outliers. The uncorrected data includes dark count, dead time,
UVA correction and uses the latest response function.
- Cosine correction
Sabburg and Meltzer (2000) explain the cosine correction methodology
associated with the full sky diffuser in detail. In summary, cosine
response measurements were made on each Brewer using the irradiance
of a standard 1000 W lamp. These measurements were performed in
the laboratory. The final values were based on an average of measurements
along the long and short sides of the Brewer, five wavelengths
and two sets of zenith angles. The wavelengths were 306.3, 310.1,
313.5, 316.8 and 320.1 nm. The lamp rotated over the zenith angle
range of ö 80 to 0 ° and 0 ° to 80 ° in 10 ° steps.
The equations of Bais et al. (1998) were used to calculate the total cosine correction assuming
a diffuse isotropic sky and the ratio of the direct / global irradiance
was based on the clear-sky model of Rundel (1986). The model used
corrected ozone amounts from the Brewer and a typical value of
aerosol optical depth (AOD) was chosen for each site, namely,
0.2, 0.1, 0.8 and 0.5 for Boulder, Rocky, Gaithersburg and RTP
respectively (Jeral Estupinan, Personal Communication, 2000).
When ozone data was not available, the nominal value of 300 DU
was used for that day.
- Temperature Dependence
The temperature dependence of two of the Brewers (#101 and #146),
was measured by the NUVMC during a field campaign in July 2000.
The methodology for measuring the temperature dependence is outlined
by Meltzer et al. (2000). The Brewer temperature fluctuates with the ambient at
the various locations from 0 to + 50 ° C. The temperature dependence from - 18 to + 42 ° C of the response of three MKIV Brewers (not the Brewers in this
current paper), has been determined in the laboratory using a
controlled variable temperature environment. The observed temperature
coefficients of their responses at 306 nm were - 0.17 %, - 0.22
% and - 0.37 % per ° C. This results in a predicted seasonal variation of their sensitivity
of up to approximately 20 %, well beyond the desired accuracy
of ± 3 %. There is a significant wavelength dependence of the temperature
coefficient below 325 nm. This is primarily due to the temperature
dependence of the transmission of a nickel sulfate filter.
The methodology also requires that local operators obtain the
temperature coefficients of the response as a function of wavelength
at each site. The method utilizes spectra of the 50 W Brewer calibration
lamps recorded throughout the day during the diurnal temperature
cycle. These measurements require more accurate and stable instrumentation
than is supplied with the Brewer. Plots of the photon counts versus
temperature at each wavelength were used to determine a temperature
coefficient, D R/D T, which is the slope of the response versus temperature. The
temperature corrections were achieved by normalizing photon counts
to an equivalent photomultiplier tube (PMT) temperature of 20
° C.
- Temporal Variation
The temporal variation in the instrument response is due to optical
changes in the characteristics of the instruments. This necessitates
an annual UV irradiance calibration, using a secondary standard
lamp traceable to the NIST 1000 W lamp, to be performed at the
sites by NUVMC staff. Resulting response functions are used to
calculate irradiance from photon counts. In addition, NOAA, using
similar equipment to the NUVMC, conduct independent quality assurance
audits of the instruments. Details of these procedures are available
at the UGA web address: ftp://oz.physast.uga.edu/Outgoing/ by downloading the three documents entitled: SOP1_FEL-Lamp.doc,
SOP for Field Calibration.doc and Irradiance Transfer of 1000
Watt lamps.doc.
C) Model UV data
In order to make a comparison of the corrected UV data (in addition
to comparing to the uncorrected data), the data calculated by
the clear sky model, Uvspec, was used (Kylling 1995). UVSPEC used
the wavelength range of 280 to 400 nm with 1.0 nm resolution and
used two-stream code to solve the radiative transfer equation.
Ozone and oxygen absorption, as well as Rayleigh scattering was
accounted for. UVSPEC used the same nominal AOD values as used
for the cosine correction, scaled according to visibility. When
ozone data was not available, the nominal value of 300 DU was
used for that day.
D) Satellite Data
Finally, a comparison is made with the inferred DUV data from
the NASA, Total Ozone Mapping Spectrometer (TOMS). TOMS data is
indicative at the time of over-pass (approximately 11:15 AM local
time) and the footprint for the TOMS instrument is approximately
40 km x 40 km. The TOMS erythemal exposures are calculated with
a radiative transfer model (Herman et al. 1996; Udelhofen et al. 1999). The TOMS algorithm uses ozone data as well as reflectivity
measurements at 380 nm to identify cloudy scenes. The daily integration
is carried out assuming no diurnal variation in cloudiness.
Results and Discussion
- Cosine, Temperature and Temporal response corrections
Table 1 lists the percentage differences, (Uncorrected ö corrected)*100/corrected,
for each UV correction, for the erythemally-weighted irradiance
corresponding to the scan around local noon on the 30th May 1999 for data at the four sites. In addition, Table 1 lists
the range of percentage differences for all UV corrections, of
daily-integrated DUV values for available data at the four sites.
In this additional part of the table, the positive values for
Boulder and Rocky are due to very low temperatures during the
UV measurements. For example, at Boulder on the 12th January 1997, the PMT temperature of the Brewer ranged from ö16
to ö10 ° C. The positive values for RTP were due to large values of stray
light entering the PMT.
TABLE 1
|
Type of Correction
|
Boulder
|
Rocky
|
Gaithersburg
|
RTP
|
|
Stray-light
|
2.2
|
2.5
|
5.4
|
2.1
|
|
Temporal
|
-6.2
|
0.4
|
-9.3
|
-16.4
|
|
Temporal & Temperature
|
-14.5
|
0.8
|
-
|
-
|
|
Cosine
|
-5.7
|
-11.1
|
-11.6
|
-9.5
|
|
All corrections
|
-18.4
|
-8.1
|
-16.0
|
-22.7
|
|
% DUV range for all corrections
|
-22.2 to 14.8
|
-13.8 to 6.0
|
-23.5 to ö4.4
|
-26.8 to 20.8
|
- Comparison between uncorrected, corrected and clear sky model
data
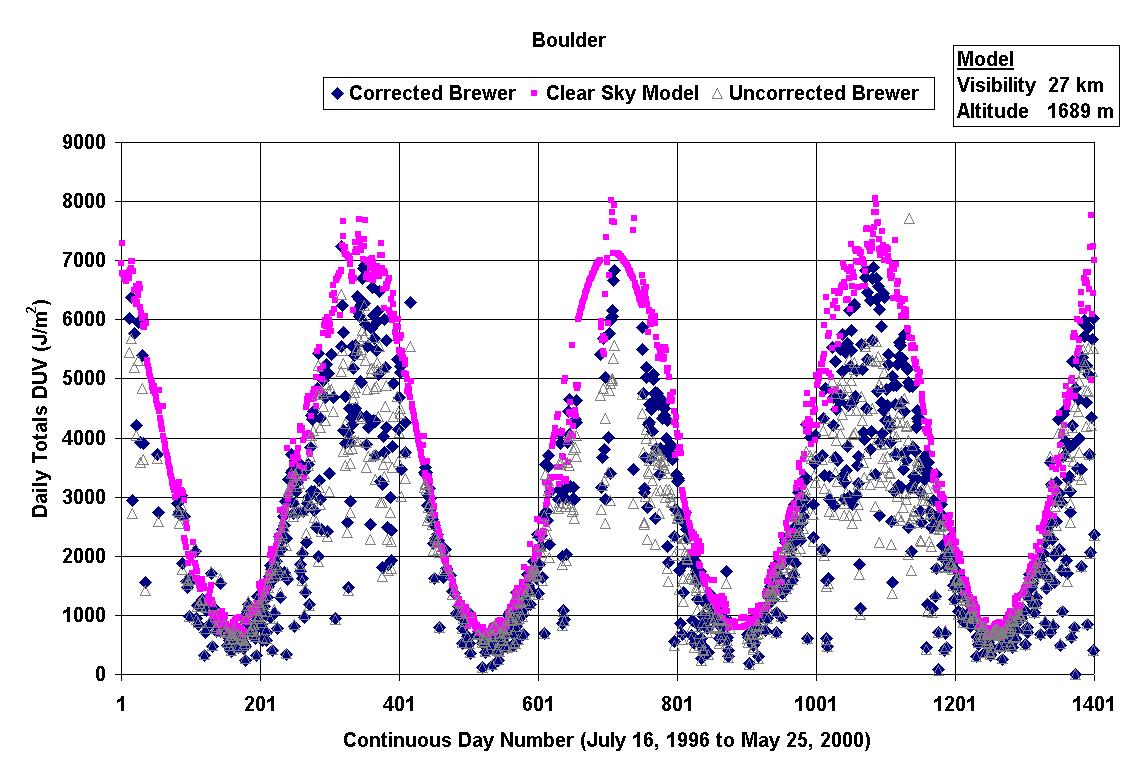
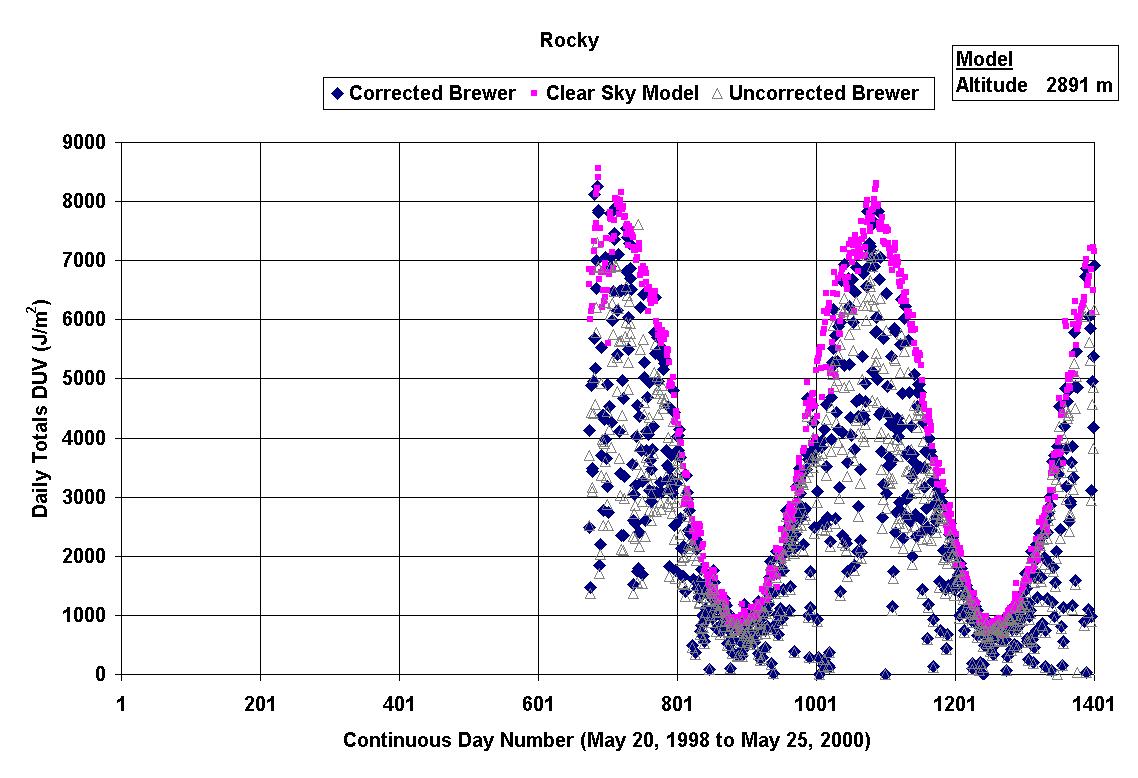
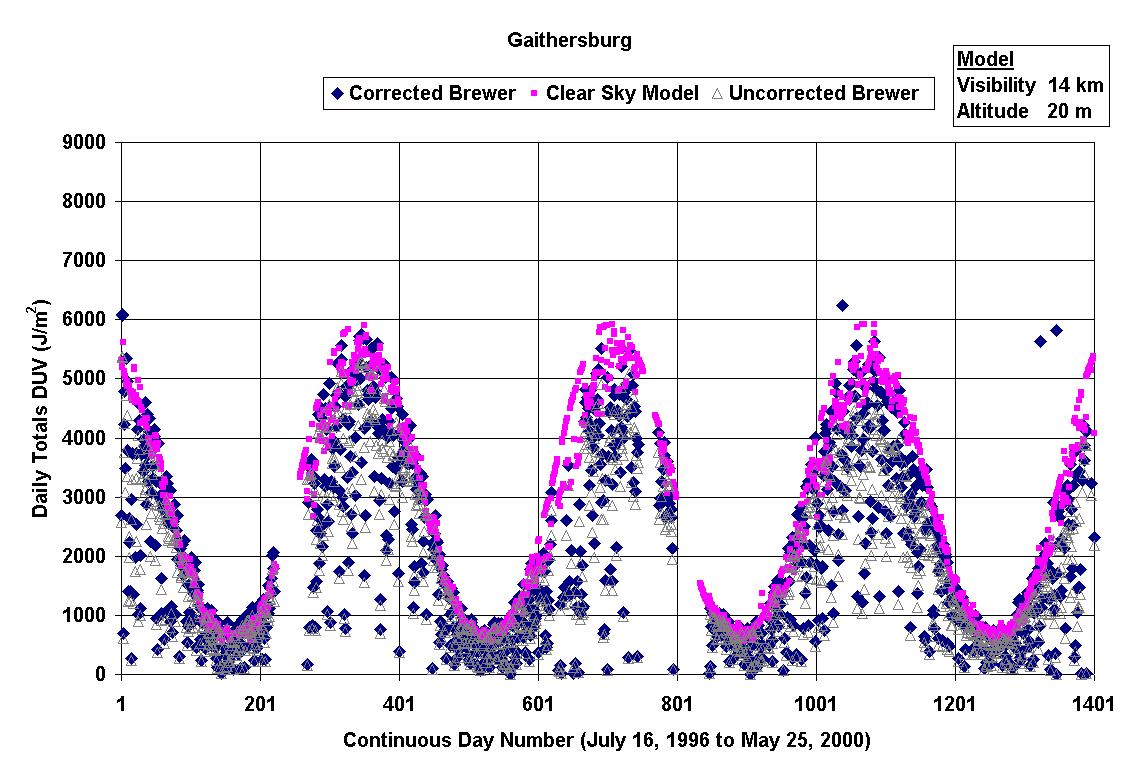
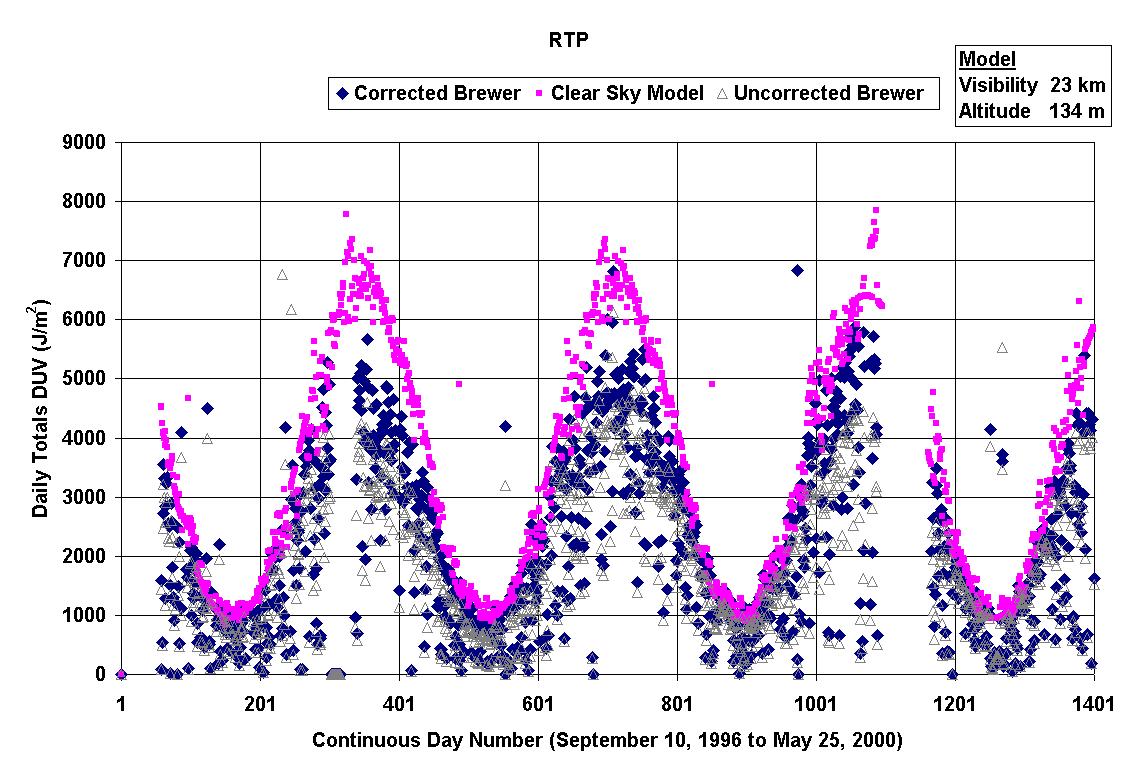
Figure 1 presents a graph of the uncorrected, corrected and clear-sky
model data for (a) Boulder (b) Rocky (c) Gaithersburg and (d)
RTP.
(a)
(b)
(c)
(d)
Figure 1. Graphs showing the daily DUV levels for (a) Brewer # 101 (b) # 146 (c) # 105 and (d) # 087, compared to the corresponding clear-sky modeled data for
the dates as shown on the x-axes.
The corrections bring the measured DUV in closer agreement with
the clear sky modeled calculations.
Figure 2 shows an example correlation graph of clear-sky, uncorrected
and corrected DUV data versus clear-sky modeled data for Boulder.
Clear-skies are defined as days for which the corresponding TOMS
reflectivity data was less than 5 %. Only data where a full day
of UV scans and measured Brewer ozone data were available are
presented and used for analysis purposes. A linear correlation
is shown for both the corrected and uncorrected Brewer DUV data
with respect to the modeled data.
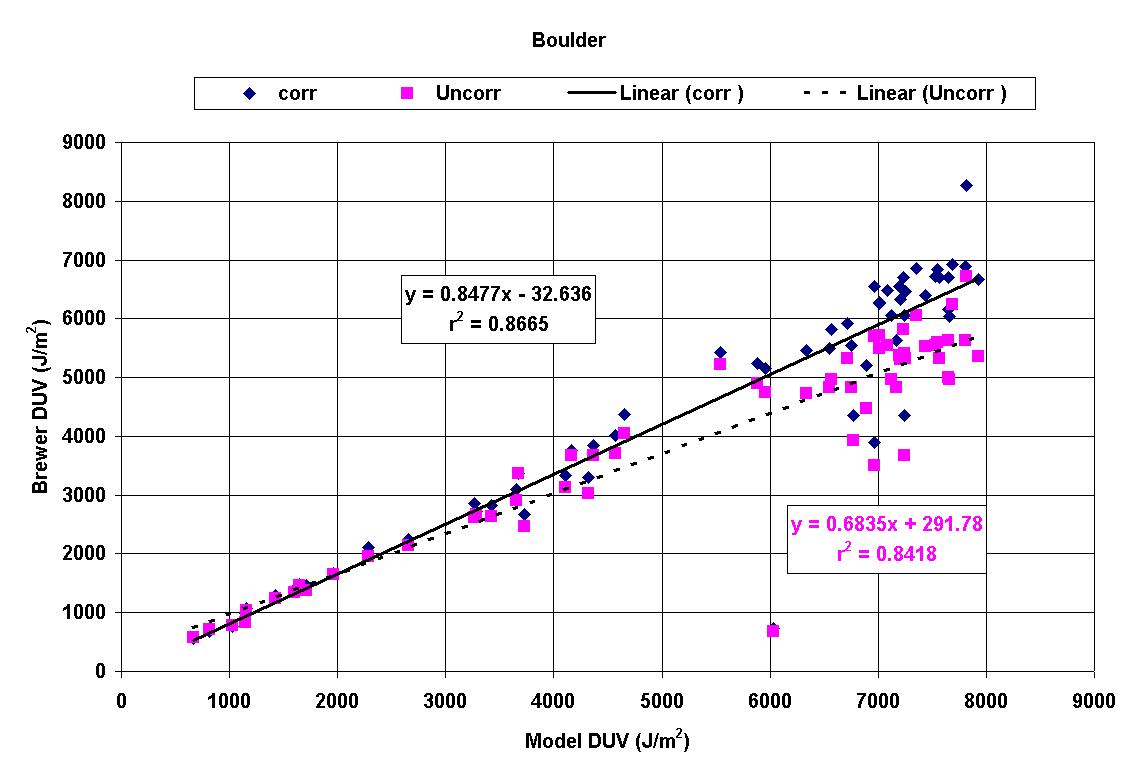
Figure 2. Graph showing daily, clear-sky Brewer DUV data versus clear-sky
model data. The linear correlation and information box shown at
the top of the graph corresponds to the corrected Brewer data.
The clear-sky corrected data show improvement in the correlation
coefficient and are in better agreement with model clear-sky calculations,
but they still fall below the model DUV values by approximately
15 %.
Figure 3 shows a time series graph corresponding to Figure 2,
for corrected and model data only. The differences between the
corrected and modeled data, (Corrected ö Model)*100/Model, is
ö 44.1 to 5.7 %, with an average difference of ö 14.5 %. The larger
values of the model calculation is in part due to the fact that
some clear days, defined by TOMS overpass data at approximately
11:15 AM local time, may not remain clear throughout the whole
day. In addition, the UVSPEC model may overestimate the irradiance
because the optical depth and ozone were held constant throughout
the day.
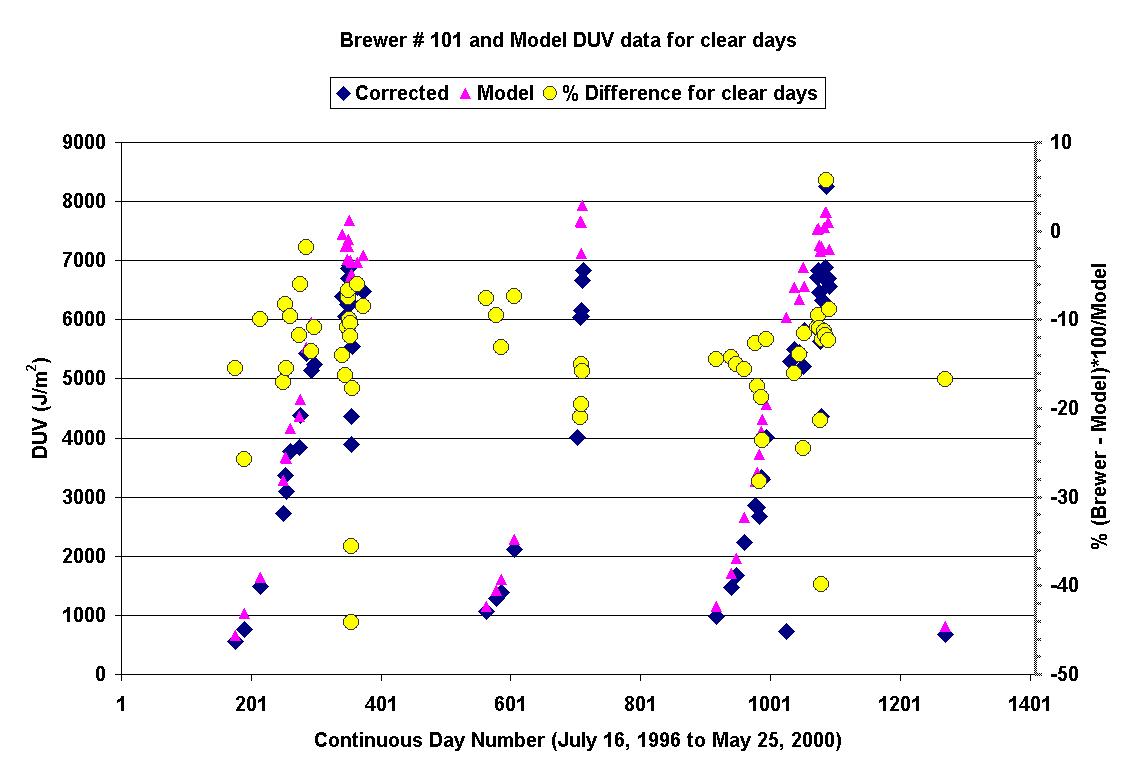
Figure 3. Graph showing clear-sky daily DUV levels for Brewer # 101 compared
to the clear-sky modeled data.
- Comparison between corrected and satellite data
(a)
(b)
(c)
(d)
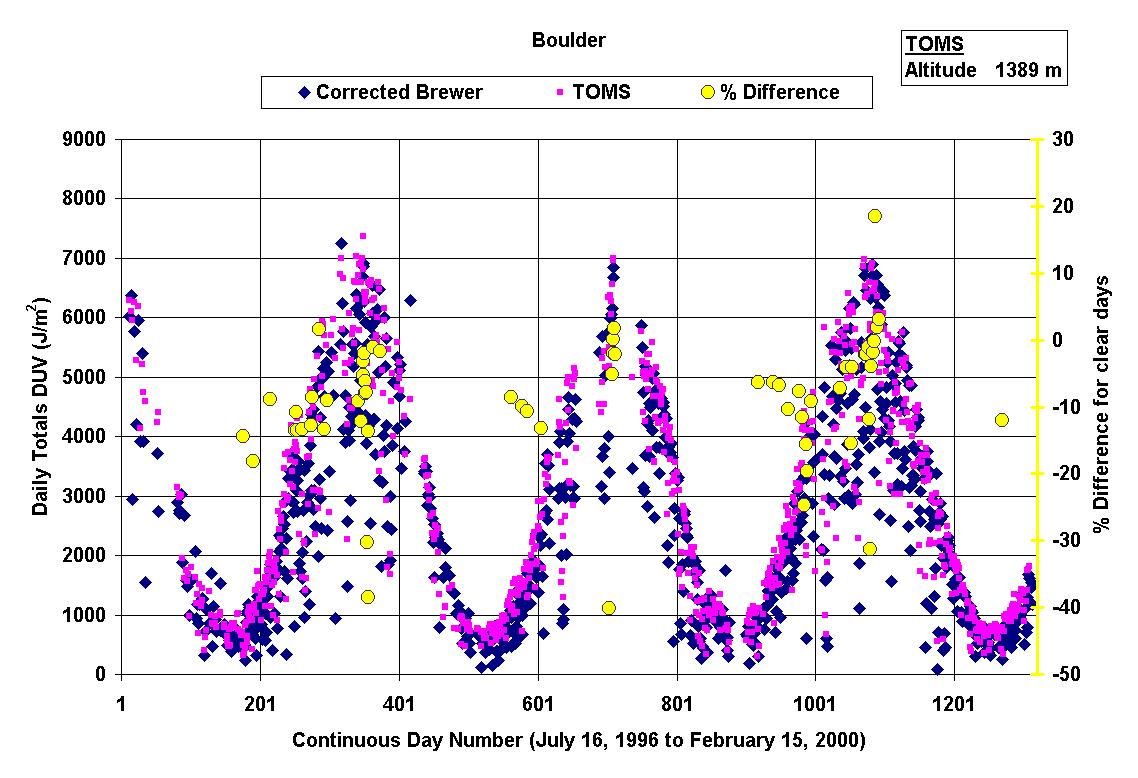
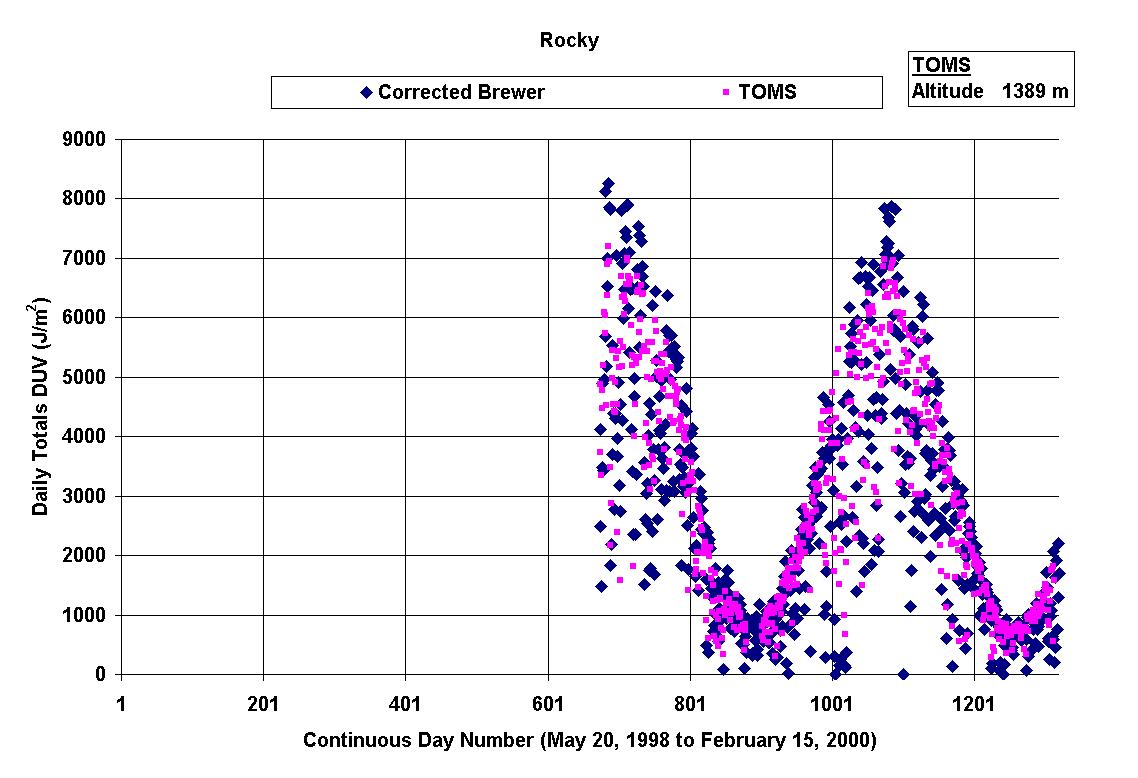
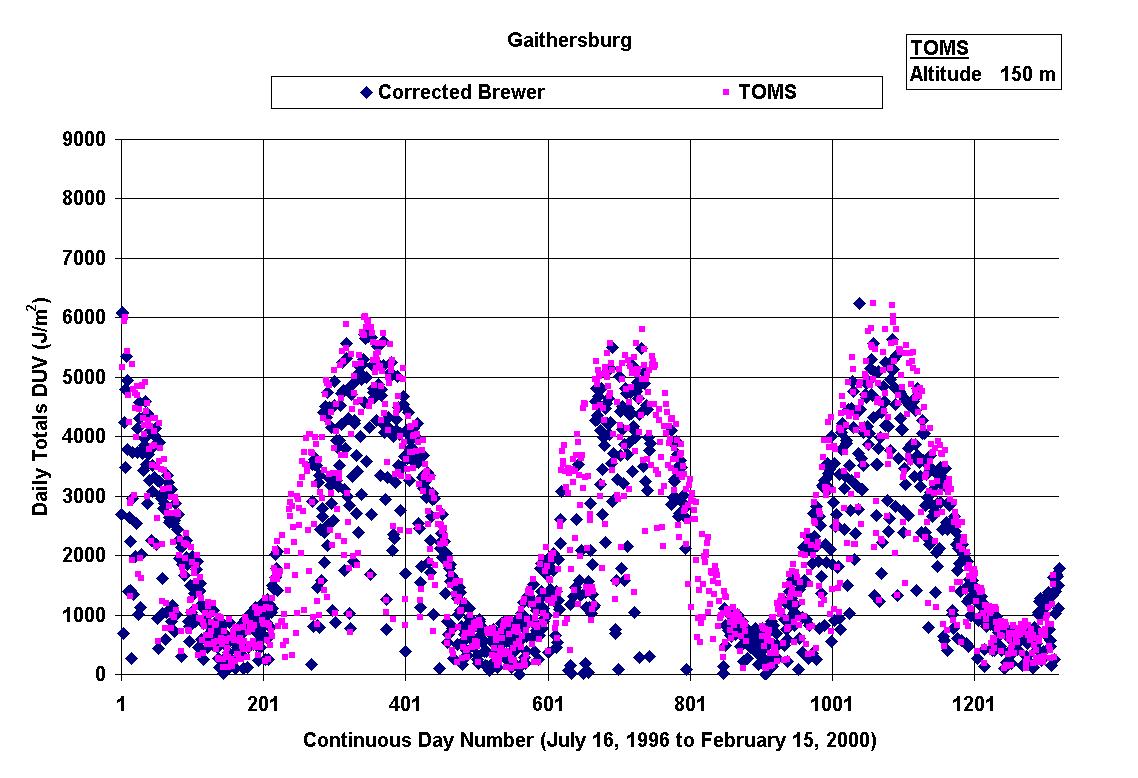
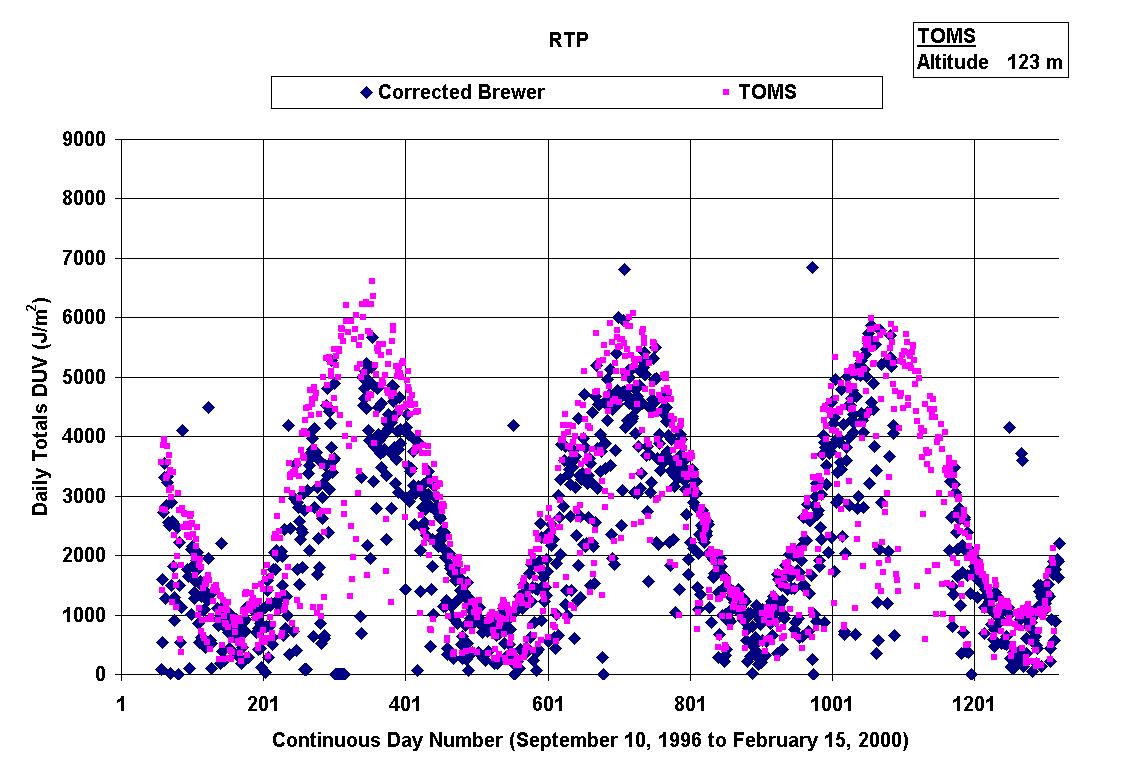
Figure 4. Graph of corrected and corresponding TOMS DUV data for all available
data for (a) Boulder (b) Rocky (c) Gaithersburg and (d) RTP. In the case of Boulder, the right hand axis shows the percentage
difference, (Corrected ö TOMS)*100/TOMS, for clear days.
Figure 4 shows time series graphs of corrected and TOMS data for
the four sites. In the case of Figure 4 (a) for Boulder, the variation
between the corrected and TOMS data, (Corrected ö TOMS)*100/TOMS,
for clear days is also shown. The range of differences between
TOMS-inferred and corrected DUV is from ö 40.1 to 18.5 %, with
an average difference of ö 9.1 %. The larger values of the TOMS
calculation is in part due to the fact that some clear days, defined
by TOMS overpass data at approximately 11:15 AM local time, may
not remain clear throughout the whole day.
Finally, Table 2 summarizes the correlation and percentage difference
data for the clear days, for uncorrected, corrected, model and
TOMS data for the four sites. The comparison with TOMS data for
Rocky (showing a positive value of 3.4 in Table 2) is most likely
a result of the lower altitude used by the TOMS model corresponding
to this site (1389 m). The comparison with model data for Gaithersburg
(showing a positive value of 7.9 in Table 2) may be due to overestimation
of the AOD for this site.
TABLE 2 Comparison of clear day corrected daily-integrated DUV values
at four sites with values predicted with the UVSPEC model and
those values inferred from TOMS overpass measurements.
| SITE |
Correlation: uncorrected with model (r2) |
Correlation: corrected with model (r2) |
Average %:
(Corr-model)*100/ model |
Average %:
(Corr- TOMS)*100/
TOMS |
| Boulder |
0.84
|
0.87
|
- 15
|
- 9
|
| Rocky |
0.80
|
0.87
|
-13.9
|
3.4
|
| Gaithersburg |
0.97
|
0.98
|
7.9
|
-8.3
|
| RTP |
0.92
|
0.90
|
- 12.1
|
- 10.5
|
Conclusions
In order to bring the error of measured absolute irradiance values
to within ± 5 %, correction for the temperature dependent response, temporal
variation of response and the angular dependence of the collector
are essential. The corrected DUV values for clear sky conditions
are in much closer agreement with a theoretical model and generally
show better correlation with that model compared to the uncorrected
values.
Correction of the data at the four sites studied, fall in the
range - 27 to 21 %. Clear-sky corrected DUV values fall in much
closer agreement with TOMS-inferred DUV values. The average differences
between clear-sky TOMS-inferred and corrected DUV values are in
the range of - 11 to 3 %, with the smallest average value of 3
% corresponding to the Rocky site.
Acknowledgments
The authors would like to thank EPA project officers Jack Shreffler
and Tom Lumpkin, the site operators at Boulder, Rocky Mountain
and Gaithersburg, the NASA/Goddard Space Flight Center via Edward
Celarier (Software Corporation of America) whom we would like
to thank for the special TOMS UV overpass runs and Jeral Estupinan
for advice on aerosol optical depth values.
References
Bais, A.F., Kazadzis, S., Balis, D., Zerefos, C.S. and Blumthaler,
M. 1998 ÎCorrecting global solar ultraviolet spectra recorded
by a Brewer spectroradiometer for its angular response errorâ,
Applied Optics, vol. 37, no.27, pp.6339-6344.
Herman, J.R., Bhartia, P.K., Ziemke, J., Ahmad, Z. and Larko,
D. 1996 :UV-B increases 1979-1992 from decreases in total ozoneâ,
Geophys. Res. Lett., 23, pp.2117-2120.
Kylling, A., 1995: UVSPEC , a program for calculation of diffuse
and direct UV and visible fluxes and intensities at any altitude',
available by anonymous ftp to kaja.gi.alaska.edu, cd pub/arve.
McKinlay, A.F. and Diffey, B.L. 1987: A reference action spectrum
for ultraviolet induced erythema in human skin, in Human Exposure to Ultraviolet Radiation: Risks and Regulations, edited by W.R. Passchier and B.F.M. Bosnjakovic, pp.83-87, Elsevier,
New York.
Meltzer, R.S., Wilson, A., Kohn, B. and Rives, J.E. 2000: Temperature
dependence of the spectral response for the MKIV Brewers in the
UGA/USEPA networkâ, 6th Brewer Workshop, Tokyo, Japan, 10-12th July 2000.
Rundel, R. 1986: Computation of Spectral Distribution and Intensity
of Solar UV-B Radiationâ: in 'Stratospheric Ozone Reduction, Solar Ultraviolet Radiation and
Plant Lifeâ, ed. R.C. Worrest, M.M. Caldwell, Springer-Verlag, Berlin.
Sabburg, J. and Meltzer, R.S., 2000: Cosine corrections for ultraviolet
radiation data from the USEPA/UGA Brewer Networkâ, Sixth WMO/GAW Brewer Users Group Meeting, Japan Meteorological Agency (JMA), Tokyo, JAPAN, July 10-12.
Sabburg, J., Meltzer, R.S. and Rives, J.E., 2000: Corrected Ozone
and erythemal ultraviolet radiation data from the USEPA/NUVMC
Brewer Networkâ, Quadrennial Ozone Symposium, Hokkaido University, Sapporo 2000, 3-8 July, Japan, pp.759-760.
SCI-TEC 1999: Brewer MKIV Spectrophotometer Operatorâs Manual,
OM-BA-C231 REV B, August 15â, SCI-TEC Instruments Inc.
Udelhofen, P.M., Gies, P., Roy, C., Randel, W.J., 1999: Surface
UV radiation over Australia, 1979-1992: Effects of ozone and cloud
cover changes on variations of UV radiation, J. Geophys. Res., 104(D16), pp.19135-19159.
Back to