(1)Max Planck Institute for Meteorology, Hamburg, Germany
(2)Max Planck Institute for Chemistry, Mainz, Germany
FIGURES
Abstract
Introduction
Aspects of the middle atmosphere circulation as simulated by the
MAECHAM/CHEM climate system model are evaluated. The model extends
form the surface to about 80 km, it consists of the MAECHAM4 general
circulation model, GCM, (Manzini and McFarlane, 1998; Manzini
and Feichter, 1999) for the thermodynamics and physics of the
atmosphere and the CHEM chemical model (Steil et al. 1998, 2000)
for the evolution of ozone, H2O as a chemical species, and other
relevant chemical species. The CHEM model includes heterogeneous
chemistry. The transport scheme for the chemical species is the
mass flux SPITFIRE (Rash and M. Lawrence, 1998). Process interactions
include the photolysis rate computation (physics to chemistry),
the transport of chemical species (dynamics to chemistry), the
evolution of radiative active trace gases as ozone, water vapor,
CH4 and N20 (chemistry to radiative forcing).
Results
Results are presented for 15 year ensemble means from two simulations respectively for typical conditions of 1990 ("present" simulation) and of 1960 ("near past" simulation). The AMIP average sea surface temperature, SST, have been used for the "present" simulation and GISS-HADLEY (average 1951-1960) for the "near past" simulation. See also Brühl et al. poster in Session 1. Results are also presented from a 15 year simulation (hereafter FKO3) with the GCM component only, with specified observed ozone climatology (Fortuin and Kelder, 1998), present conditions for greenhouse gases and the AMIP SST. For a detailed evaluation of the simulations with respect to observations see Brühl et al. poster in Session 1.

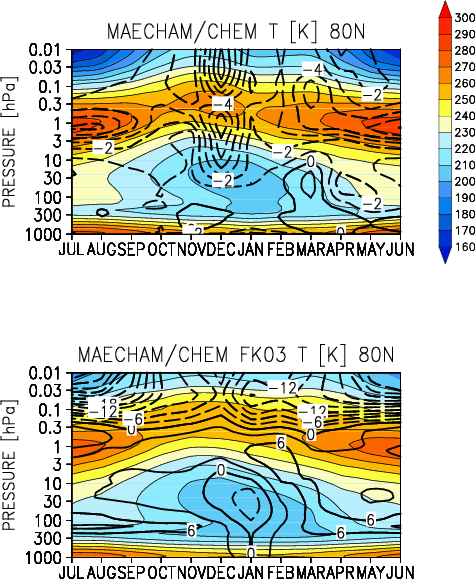
Figure 1: (upper) In color, ensemble monthly zonal mean temperature [K]
from the "near past" simulation. Time - pressure section at 80N.
Black contour: Difference, "present" -"near past" simulations,
of the ensemble monthly zonal mean temperature [Contour: 1 K].
Time - pressure section at 80N. (lower) In color, ensemble monthly
zonal mean temperature [K] from the FKO3 simulation with the GCM
component only, with specified observed ozone climatology (Fortuin
and Kelder, 1998) and present conditions for greenhouse gases.
Time - pressure section at 80N. Black contour: Difference, "present"
- FKO3 simulations, of the ensemble monthly zonal mean temperature
[Contour: 3 K]. Time - pressure section at 80N.
Figure 1 (upper) shows the seasonal evolution of the warm stratopause,
higher in winter, the cold summer mesopause, and the cold (~210
K) polar lower stratosphere in winter. There is general cooling
of the atmosphere: Cooling of the stratopause, largest in summer
(~6 K) and complicated cooling pattern from October to March,
presumably affected by dynamical variability. Weak warming mainly
confined to the troposphere.
Figure 1 (lower) shows a warming (up to 9 K in summer) in the
lowermost stratosphere (~200 hPa), due to downward and poleward
transport of ozone in the "present" simulation with interactive
chemistry. During the polar night the "present" simulation is
colder. The large cooling in the mesosphere (largest at the summer
pole) is due to diurnal cycle variations in ozone (minimum in
sunlight) included in the interactive simulation. The FKO3 ozone
is instead a monthly mean, extrapolated from the middle to the
upper mesosphere.

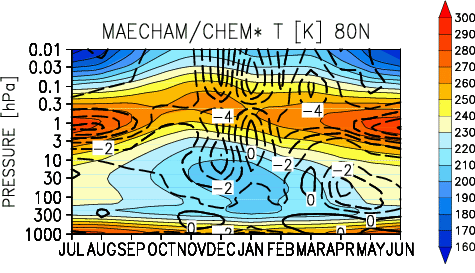
Figure 2: As in Figure 1 (upper), but the ensemble mean of the "present"
simulation is based on 13 years only, to exclude the winter season
when a particularly strong (but not major) stratospheric warming
occurred in November. Note a more gradual cooling of the middle
stratosphere in early winter. The December cooling is decreased
(wrt Figure 1) in the upper stratosphere. The March weak warming
is persistent. The alternate modulation of the temperature difference
suggests a change in the seasonal stability of the polar vortex:
more active in early winter, quiescent in mid winter and again
more active in spring, in the "present" with respect to "near
past" simulation.

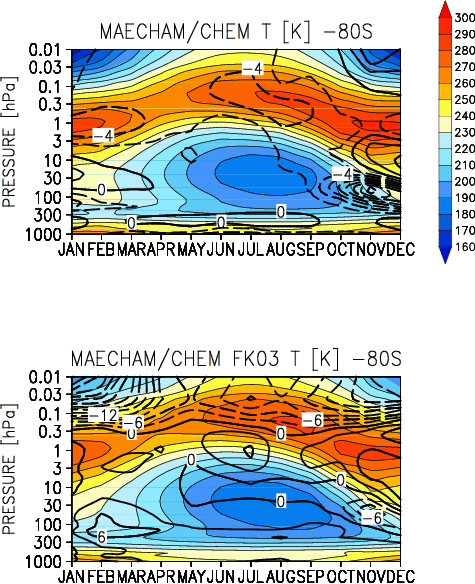
Figure 3: As Figure 1, but at 80S, and 2 K black contour in upper panel.
Note the pronounced descent of the warm stratopause in late winter
and the quite cold (~180 K) polar lower stratosphere in winter.
As for the northern hemisphere, there is general cooling of the
atmosphere, i.e., around the stratopause and in the lower stratosphere
from September to December-January. The latter (16 K of difference
in November) is associated with ozone destruction by heterogeneous
chemistry. The warming above is the dynamical response: increased
descending motions in the polar region. See Figure 4. As for the
northern hemisphere, with interactive chemistry the mesosphere
cools, especially in summer, and the lowermost stratosphere (~200
hPa) warms. The cooling in November (due to the ozone hole) is
consistent with the fact that the FKO3 ozone climatology is more
representative of the 1980s, while the "present" simulation of
the 1990s.

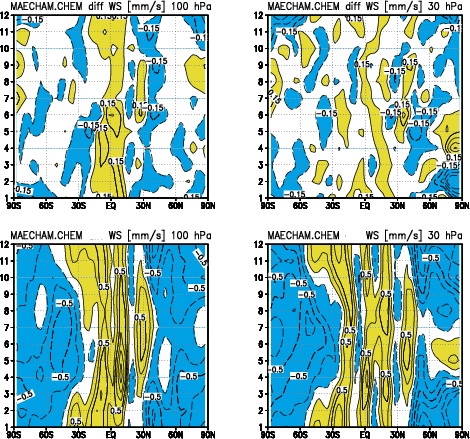
Figure 4: (upper) Difference, "present" - "near past", of the ensemble
monthly mean residual vertical velocity [mm/s]. Latitude - time
section (left) at 100 hPa and (right) at 30 hPa. Contour: 0.1
mm/s. Yellow is above 0.05 mm/s, blue below -0.05 mm/s. Month
1 is January. (lower) Ensemble monthly mean residual vertical
velocity [mm/s] from the "near past" simulation. Latitude - time
section (left) at 100 hPa and (right) at 30 hPa. Contour: 0.1
mm/s.Yellow is above 0.05 mm/s, blue below -0.05 mm/s. Month 1
is January
At 100 hPa, Figure 4 (upper) shows increased equatorial upwelling relatively homogeneous in time, associated with cooling, and consistent with a localized decrease in ozone. Given the large vertical gradient in ozone, finer vertical resolution would help in characterizing the tropopausal changes. Compensating downwelling larger in the subtropics.
At 30 hPa, Figure 4 (upper) shows that at northern polar latitudes, the donwelling from December to March is increased, indicating larger dynamical activity in the "present" simulation, in spite of the polar average cooling (Figure 1). South Pole December: Increased dowelling consistent with the persistence of the polar vortex (Figure 3).
At 100 hPa, Figure 4 (lower): Upwelling in the tropics and downwelling in the extratropics. Note the seasonal shift of the latitude where the residual vertical velocity change sign. The magnitude of the tropical upwelling (~0.5 mm/s) is consistent with estimate of it from comparison of the simulated water vapor with HALOE observations.
At 30 hPa, Figure 4 (lower): Downward velocities in the extratropics, their magnitude larger in mid winter. Rich latitudinal structure in tropical upwelling.
Conclusions
The evaluation of the change between the "present" and "near past"
simulations has revealed that the stratopause region and the antarctic
lower stratosphere are most sensitive regions. The results are
here summarized:
The temperature changes at the stratopause are associated with
ozone destruction (homogenous chemistry), decrease of 10-20% in
the 10-1 hPa range, as well as changes in the greenhouse gases
concentrations. The sensitivity of the stratopause region is consistent
with the estimate of temperature trends, increasing with elevation
(WMO, 1998).
The temperature changes in the antarctic lower stratosphere are
due to ozone destruction by heterogeneous chemistry. Thus, the
polar vortex lasts to December.
Temperature changes of about 2 K occur close to the equatorial
tropopause and are associated with an increase in tropical upwelling.
Cooling of the arctic stratosphere, affected by dynamical variability.
It is suggestive of a change in the seasonal stability of the
polar vortex, more active although colder in the early winter
of the "present" simulations. In qualitative agreement with Labitzke
and Naujokat (2000). The specified 1960 and 1990 conditions of
the two simulations impede the comparison with the temperature
trends of Randel and Wu (1999).
Acknowledgements
We are grateful to L. Bengtsson and P.J. Crutzen for their interest in initiating and supporting the model developments at the basis of this work.
References
Fortuin, J.P., and H. Kelder, 1998: An ozone climatology based
on ozonesonde and satellite measurements, J. Geophys. Res., 103,
31709-31734. Labitzke, K and B. Naujokat, 2000: The lower arctic
stratosphere in winter since 1952, SPARC Newsletter 16.
Manzini, E., and H. Feichter, 1999: Simulation of the SF6 tracer with the middle atmosphere MAECHAM4 model: Aspects of the large-scale transport, J. Geophys. Res., 104, 31097-31108.
Manzini, E., and N.A. McFarlane, 1998: The effect of varying the source spectrum of a gravity wave parameterization in a middle atmosphere general circulation model, J. Geophys. Res.,103, 31523-31539.
Randel, W. J. and F. Wu, 1999: Cooling of the Arctic and Antarctic polar stratospheres due to ozone depletion, J. Climate, 12, 1467-1479.
Rash, P.J., and M. Lawrence, 1998: Recent development in transport methods at NCAR. MPI Report 265, 65-75, Max Planck Institut für Meteorologie, Hamburg, Germany.
Steil, B., C. Brühl, E. Manzini, J.P. Crutzen, P.J. Rasch and E. Roeckner, 2000: Interactive chemistry climate modelling of the middle atmosphere. Evaluation for present conditions. Manuscript in preparation.
Steil, B., M. Dameris, C. Brühl, P.J. Crutzen, V. Grewe, M. Ponater, and R. Sausen, 1998: Development of a chemistry module for GCMs: first results of a multi-annual integration, Annales Geophysicae 16, 205-228.
WMO, 1998: Global ozone research and monitoring Project, Report
44, World Meteorological Organization, Geneva, Switzerland.
Back to
| Session 1 : Stratospheric Processes and their Role in Climate | Session 2 : Stratospheric Indicators of Climate Change |
| Session 3 : Modelling and Diagnosis of Stratospheric Effects on Climate | Session 4 : UV Observations and Modelling |
| AuthorData | |
| Home Page | |