Previous: Trends in temperatures Next: Conclusions Up: Ext. Abst.
Brewer Dobson circulation
The Brewer-Dobson circulation is a global-scale cell in the stratosphere
in which air rises in the tropics and then moves polewards and
downwards, mostly in the winter hemisphere Because it describes
Lagrangian-mean. transport it can not be diagnosed directly from
the UM integrations. Instead we have calculated the transformed
Eulerian mean residual velocities (
![]() ,
,
![]() ) (Andrews & McIntyre 1976; 1978) which approximate the mean meridional
mass transport for seasonally averaged conditions (e.g., Holton
1990). Averaged over the 60 years the residual velocities indicate
the model is able to correctly reproduce the classical Brewer-Dobson
picture of a meridional overturning circulation (see Fig. 4).
In agreement with observations the maximum upwelling occurs in
the summer hemisphere.
) (Andrews & McIntyre 1976; 1978) which approximate the mean meridional
mass transport for seasonally averaged conditions (e.g., Holton
1990). Averaged over the 60 years the residual velocities indicate
the model is able to correctly reproduce the classical Brewer-Dobson
picture of a meridional overturning circulation (see Fig. 4).
In agreement with observations the maximum upwelling occurs in
the summer hemisphere.
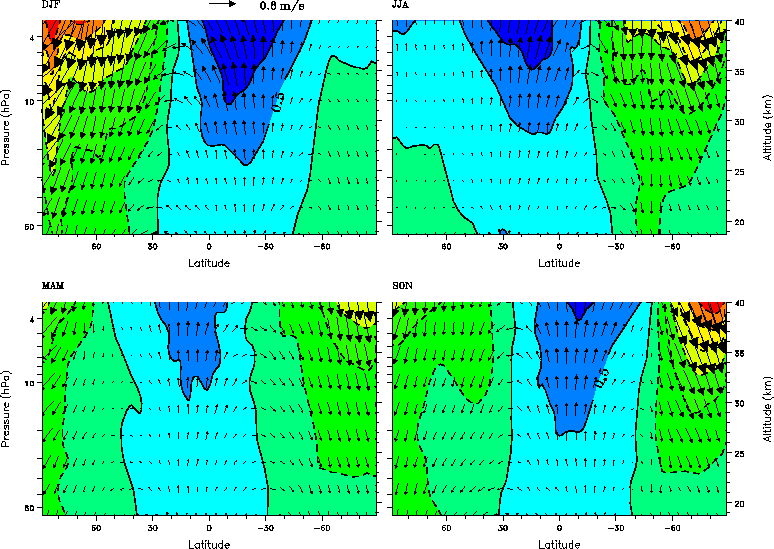
Fig. 4. Sixty year mean residual velocities (
![]() ) for each season of run B (run A results are very similar). The
contours show the strength, in mms
) for each season of run B (run A results are very similar). The
contours show the strength, in mms![]() , of the vertical component,
, of the vertical component,
![]() , with dashed contours indicating descent and blue shading ascent.
, with dashed contours indicating descent and blue shading ascent.
In each model year the smallest upward mass flux entering the
lower stratosphere was in June-August (JJA) and the largest in
December-February (DJF)(Fig. 5), presumably because of the stronger
extra-tropical wave-driving in the northern winter. In the ``1990s''
the modeled mass fluxes are in broad agreement with mass fluxes
derived from observations (Rosenlof 1995). At the same time, the
mean vertical velocity from 12![]() N to 12
N to 12![]() S (not shown), varied from
S (not shown), varied from ![]() mms
mms![]() in JJA to
in JJA to ![]() mms
mms![]() in DJF, slightly less than the 0.2-0.4 mms
in DJF, slightly less than the 0.2-0.4 mms![]() inferred from the so-called ``tape recorder'' signal seen in
water vapor measurements (Mote et al. 1995). The tape recorder signal is a manifestation of the annual
cycle in the tropical lower-stratospheric temperatures resulting
from the annual cycle in the upwelling (Yulaeva et al. 1994). Our simulated annual cycle in tropical lower stratospheric
temperatures (see Fig. 6, for run B) had the correct amplitude
and, notably, the amplitude did not change significantly over
the 60 years, despite the predicted cooling of the lower stratosphere.
Consistently, the trends in the tropical upwelling were roughly
the same in every season (Fig. 5) with the combined effect of
a 18% (19% for run A) increase in the annual mean upwelling by
2051.
inferred from the so-called ``tape recorder'' signal seen in
water vapor measurements (Mote et al. 1995). The tape recorder signal is a manifestation of the annual
cycle in the tropical lower-stratospheric temperatures resulting
from the annual cycle in the upwelling (Yulaeva et al. 1994). Our simulated annual cycle in tropical lower stratospheric
temperatures (see Fig. 6, for run B) had the correct amplitude
and, notably, the amplitude did not change significantly over
the 60 years, despite the predicted cooling of the lower stratosphere.
Consistently, the trends in the tropical upwelling were roughly
the same in every season (Fig. 5) with the combined effect of
a 18% (19% for run A) increase in the annual mean upwelling by
2051.
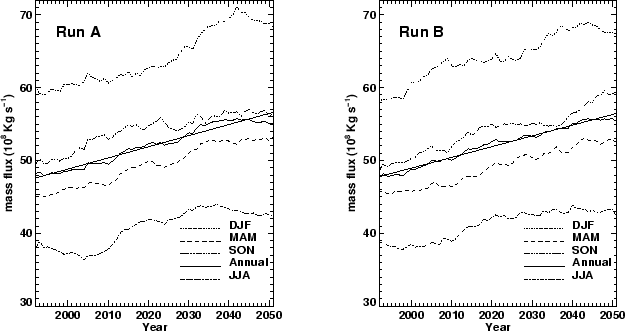
Fig. 5. Seasonal and annually averaged upward mass fluxes at 68 hPa.
The curves are 11 year running means and the straight lines are
least squares fits to the annual mean results.
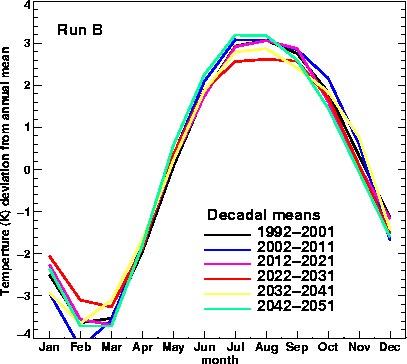
Fig. 6. The trend in the mass flux is fairly uniform throughout the
year as indicated by the absence of any change in the decadal
mean amplitude of the annual cycle in the mean temperatures from
20![]() N-20
N-20![]() S at 68 hPa.
S at 68 hPa.
The main reason for this increase in upwelling was increased extra-tropical
planetary wave driving. For steady seasonal mean conditions the
Cambridge ``downward control'' principle (Haynes et al. 1991) gives the vertical mass flux poleward of latitude ![]() at height
at height ![]() , in terms of the vertical integral of the zonal forces,
, in terms of the vertical integral of the zonal forces, ![]() , above; or more specifically
, above; or more specifically
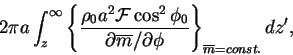
where ![]() is the earth's radius and
is the earth's radius and ![]() a basic state density. The integration is up a line of constant
zonal mean absolute angular momentum
a basic state density. The integration is up a line of constant
zonal mean absolute angular momentum
![]() (Haynes et al. 1991). At the latitudes used in our calculations these surfaces
were nearly vertical, hence we used, instead, constant latitude.
For the model,
(Haynes et al. 1991). At the latitudes used in our calculations these surfaces
were nearly vertical, hence we used, instead, constant latitude.
For the model, ![]() is the sum of the resolved planetary wave forcing given by the
Eliassen-Palm (EP) flux divergence, numerical dissipation and
unresolved forcing represented by the parameterized orographic
gravity wave drag up to 20 hPa and Rayleigh friction above that.
The latter was, however, negligible below 1 hPa and, because of
the density weighting of the integrand, had only a small effect
on the mass fluxes in the lower stratosphere.
is the sum of the resolved planetary wave forcing given by the
Eliassen-Palm (EP) flux divergence, numerical dissipation and
unresolved forcing represented by the parameterized orographic
gravity wave drag up to 20 hPa and Rayleigh friction above that.
The latter was, however, negligible below 1 hPa and, because of
the density weighting of the integrand, had only a small effect
on the mass fluxes in the lower stratosphere.
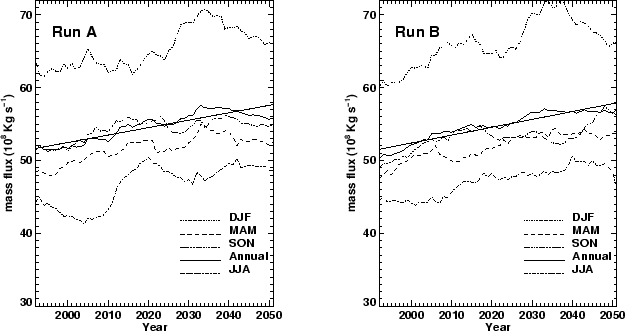
Fig. 7. Seasonal and annually averaged extra-tropical downward mass
fluxes at 68 hPa derived from the planetary wave driving by the
Cambridge downward control principle. The curves are 11 year running
means and the straight lines are least squares fits to the annual
mean results.
Quantitatively the mass fluxes derived from the EP flux divergence
agreed well in every season with those obtained directly from
the residual vertical velocities (cf. Figs. 5 and 7). The downward
control mass fluxes were slightly larger, partly because of the
absence of a small negative contribution from the Rayleigh friction--in
the mesosphere zonal mean zonal winds at the turnaround latitudes
(i.e. where the vertical velocities change direction) were generally
easterly--and also probably because of the missing contribution
from orographic gravity wave drag which was not archived from
our runs. However, the dominant contribution to the extra-tropical
downward flux at 68 hPa came from the EP flux divergence and,
in every season, increased over the 60 years (Fig. 7). Furthermore,
the 60 year increase of
![]() Kgs
Kgs![]() in the wave-driven annual mean downward mass flux in run B, for
example, balances most of the
in the wave-driven annual mean downward mass flux in run B, for
example, balances most of the
![]() Kgs
Kgs![]() increase in the tropical upwelling, confirming that the strengthening
of the Brewer-Dobson circulation was predominantly wave driven
in the model.
increase in the tropical upwelling, confirming that the strengthening
of the Brewer-Dobson circulation was predominantly wave driven
in the model.
The increased wave driving strengthening the Brewer-Dobson circulation
is most likely a direct consequence of more wave activity emanating
from the trosposphere in the region of the trunaround latitudes
where the residual vertical velocities change direction (Fig. 3).
In contrast to the analysis of ```doubled CO![]() '' (Rind et al. 1998), contributions to increased wave-driving from changes in
the focussing of the waves was small because of the absence of
any significan change in the direction of the EP flux vector (again
see Fig. 3)
'' (Rind et al. 1998), contributions to increased wave-driving from changes in
the focussing of the waves was small because of the absence of
any significan change in the direction of the EP flux vector (again
see Fig. 3)