Previous: Chemical species in the AGCM Next: Conclusions Up: Ext. Abst.
Results
The solar minimum and maximum discussed in the results represent
each an
averaged value of the 18years integration.
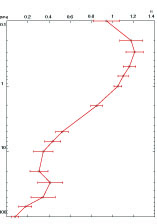
Figure 2a and Figure 2b represent the annual mean temperature and ozone content differences between solar maxium and solar minimum for a tropical latitude.
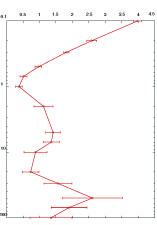
Figure 3a and Figure 3b are the annual mean temperature and ozone differences for the
zonal mean.
Figure 4 is zonal wind difference between solar maximum and solar minimum. We can see that westerly and easterly anomalies appear in the mid-high latitude each month.
In Figure 5 and Figure 6, westerly and easterly anomalies appear at latitude 70N every month.
Figure 6 shows that the anomalies shift from south to north with time.
Figure 7 shows that EP-flux anomalies direction changing every month.
The scaling factor of Fz is 125.