Ý
TUE (Eindhoven University of Technology, The Netherlands)
Email: sigmond@knmi.nl Internet: http://www.knmi.nl/~sigmond
Royal Netherlands Meteorological Institute (KNMI), P.O. Box 201, 3730 AE, De Bilt, The Netherlands.
FIGURES
Abstract
1. Introduction
A mechanism for the downward propagation of polar cap mean zonal wind (upcm) variations, hypothesized by Thompson and Wallace (1998) and Baldwin and Dunkerton (1999), has been verified using ECMWF circulation data for NH winter 1988-89.
2. Observed downward propagation of zonal wind variations
Daily ECMWF Re-Analyses (ERA-15) from October 1988 to April 1989 (horizontal resolution 2.5Ž with pressure up to 10 hPa) are used to investigate the vertical propagation of variations of the zonal wind averaged over the polar cap north of 60Ž N.
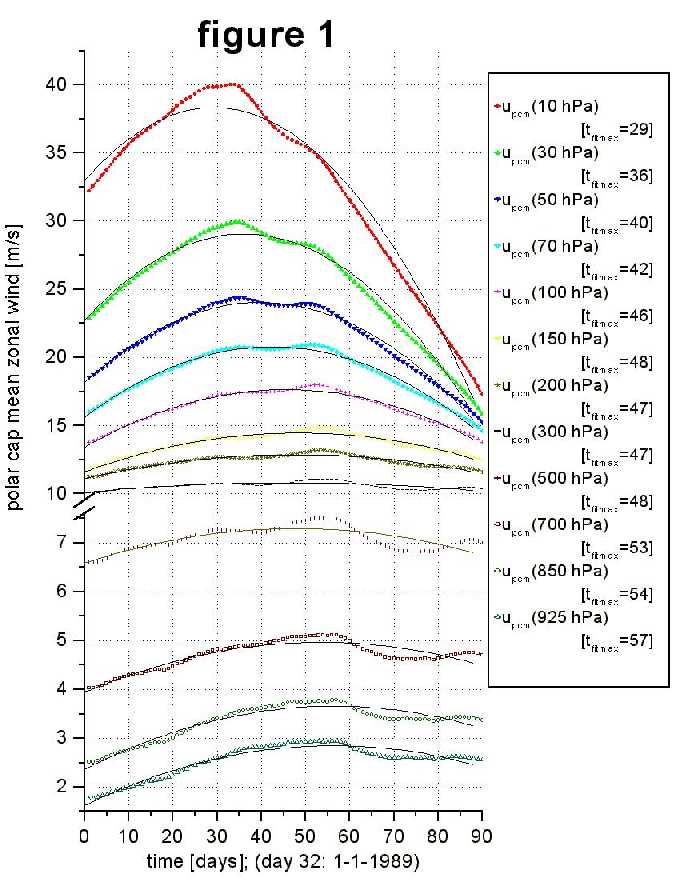
Figure 1: The low-pass (91-day running mean) filtered upcm time series and second order polynomial fits for the winter (DJF) of 1988-89 at different levels. tfitmax is the time at which the polynomial maximizes. The difference between the values of tfitmax at different levels is a measure for the time lag for variations in upcm between these levels.
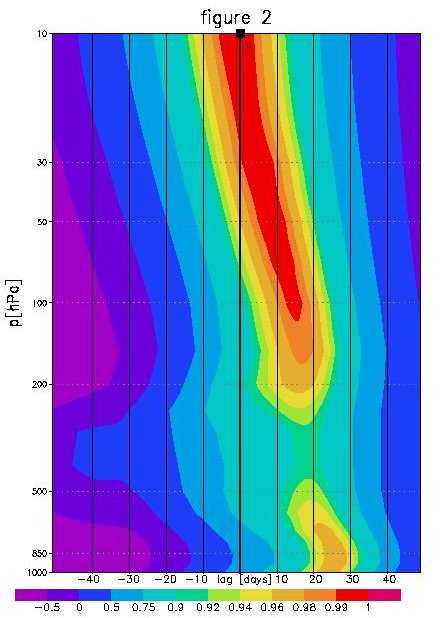
Figure 2: Correlation coefficient between the low-pass filtered upcm time series at 10 hPa and the low-pass filtered time series at all levels, with different time lags.
Figure 1 and 2 show that ultra-low frequency variations (described by the polynomial fits) of upcm propagate downward from 10 hPa to 200 hPa in about 20 days and then to the surface in about 5 days.
3. Possible Mechanism
I. Downward propagation in the stratosphere
A positive zonal-mean zonal wind anomaly (hereafter [u]', where the accent denotes the anomaly) in the stratosphere can propagate downward as follows. Planetary waves from the troposphere are refracted anomalously equatorward by anomalously large vertical [u] gradients, resulting in a positive anomaly of convergence of meridional momentum flux (hereafter Fm' ) at high latitudes just below the original [u]'. The Fm' causes an acceleration of [u], so that the original [u]' is followed by a similar anomaly at the level below. This process is then repeated for lower and lower levels, resulting in a downward propagation of the [u] anomalies. Also the Fm anomalies are expected to propagate downward.
II. Downward propagation from the lower stratosphere to the lower troposphere
The upcm variations can then propagate further down to the lower troposphere in the following 4 steps (see Fig. 3):
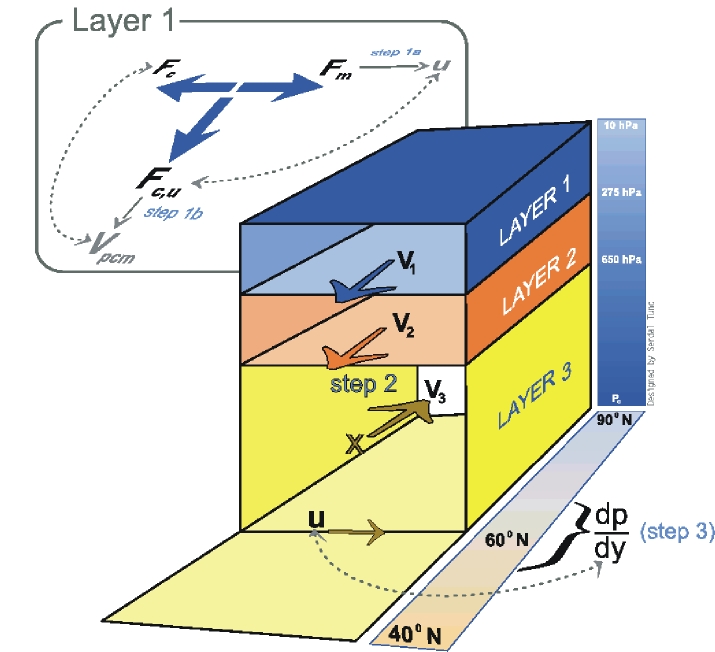
Figure 3: Illustration of the hypothesized mechanism for the downward propagation of zonal wind variations from the lower stratosphere to the lower troposphere.
4. Analysis I: Downward propagation in the stratosphere
The downward propagation of upcm variations in the stratosphere is analyzed by considering the temporal dependence of the different terms of the polar cap mean quasigeostrophic zonal momentum equation (Peixoto and Oort, 1992), neglecting friction:
The upcm tendency directly calculated from upcm [hereafter ('upcm/'t)d] closely resembles the residual upcm tendency [hereafter ('upcm/'t)r], which is the sum of the computed Fm and Fc, giving confidence in the accuracy of the computed Fm and Fc (see Figure 6).
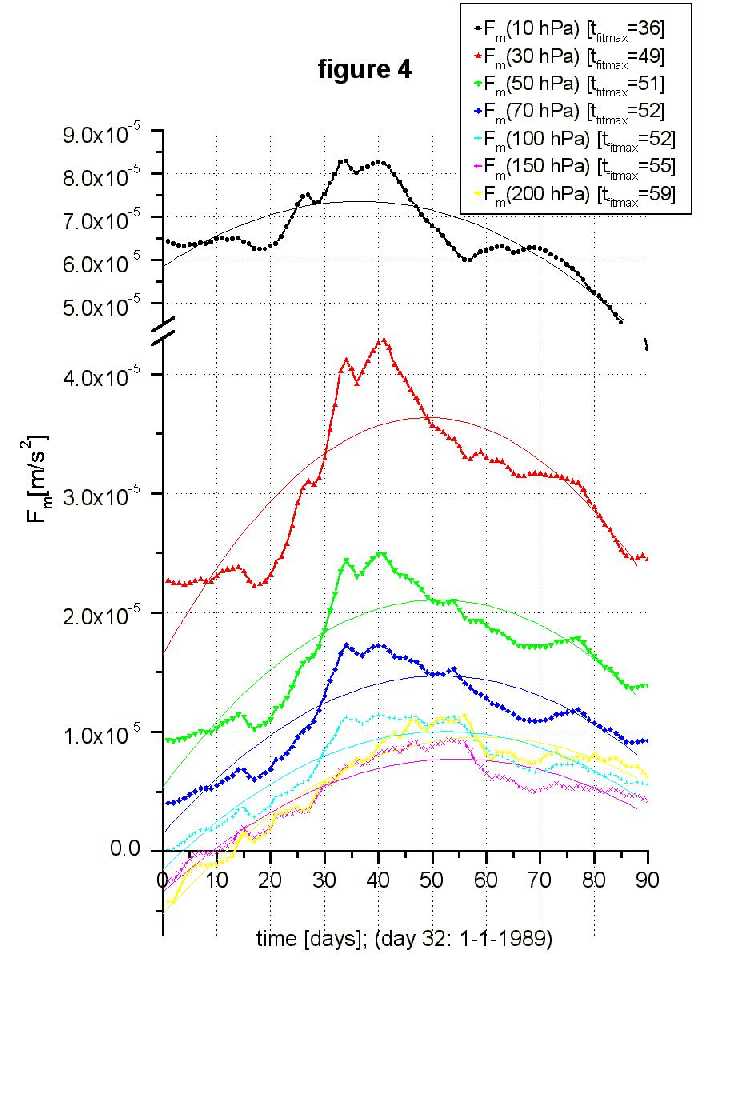
Figure 4: The low-pass filtered time series of Fm at different levels.
Ý
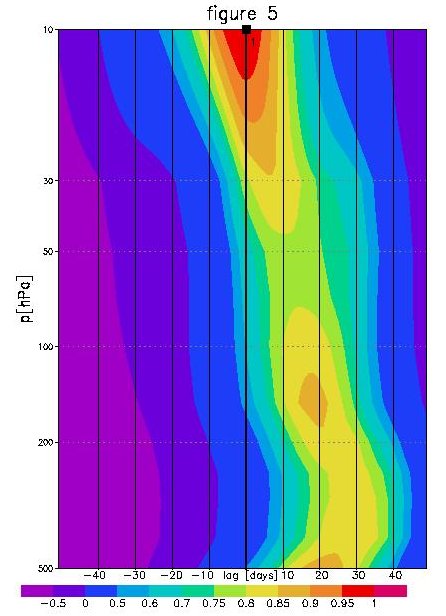
Figure 5: Correlation coefficient between the low-pass filtered Fm time series at 10 hPa and the low-pass filtered time series at all levels, with different time lags.
Figure 4 and 5 show that ultra-low frequency variations of Fm propagate downward from 10 hPa to 200 hPa in about 20 days, like the upcm variations in Figures 1 and 2, and consistent with the hypothesized mechanism.
5. Analysis II: Downward propagation from the lower stratosphere to the lower troposphere
STEP 1:
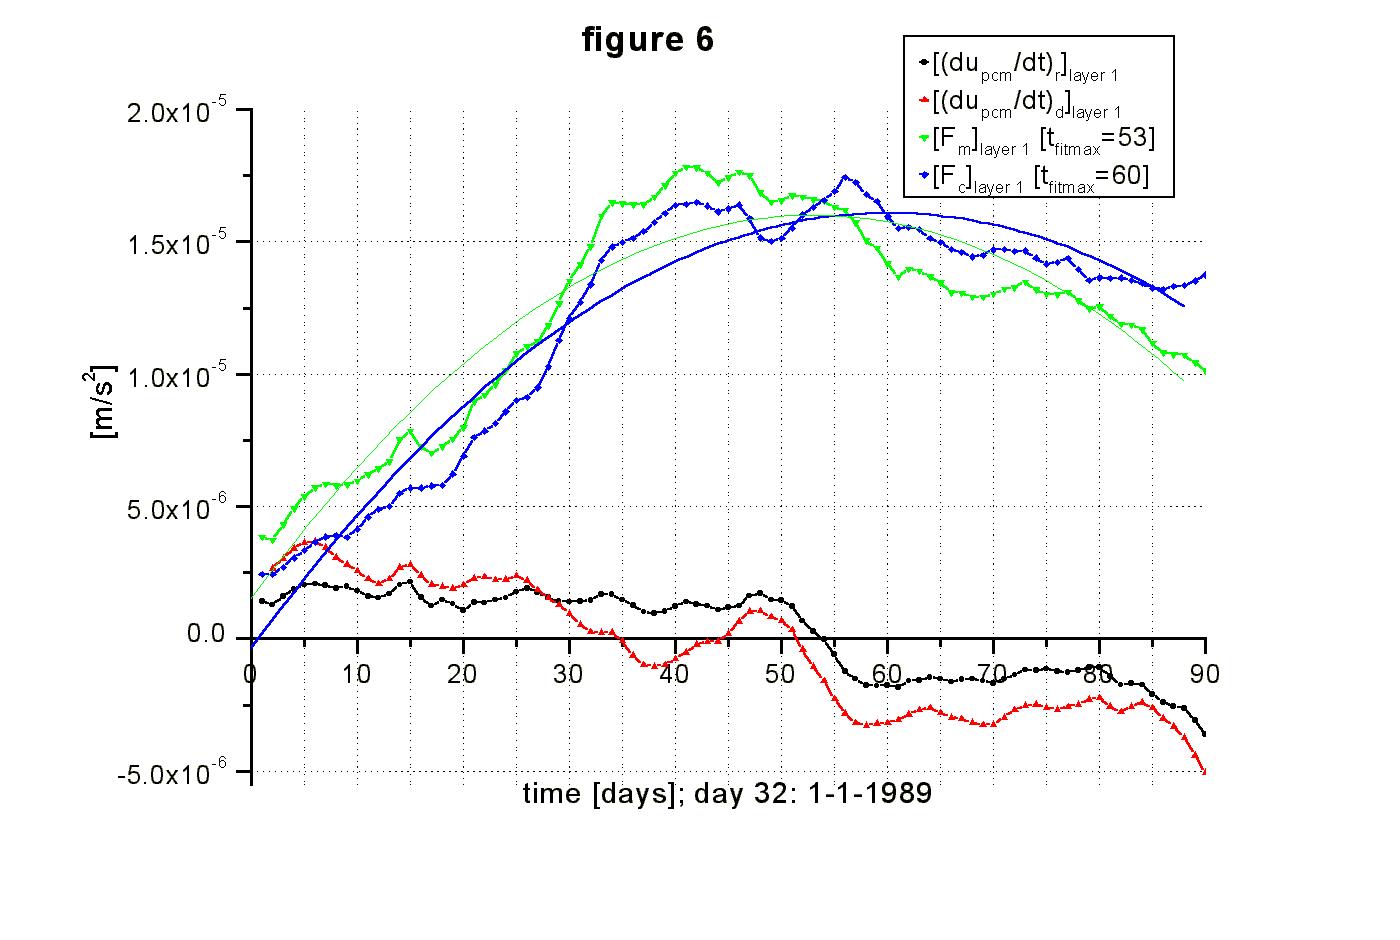
Figure 6: The low-pass filtered time series of ('upcm/'t)r, ('upcm/'t)d, Fm and -Fc averaged over layer 1 (as defined in Fig. 3). Ultra-low frequent variations in Fm are followed by similar variations in -Fc after one week, leading to a positive 'upcm/'t in the first part of the winter when Fm and -Fc increase and a negative 'upcm/'t in the second part of the winter when Fm and -Fc decrease. Fm seems to induce an equatorward flow in the stratosphere after one week, which associated zonal Coriolis force counteracts Fm.
STEP 2:
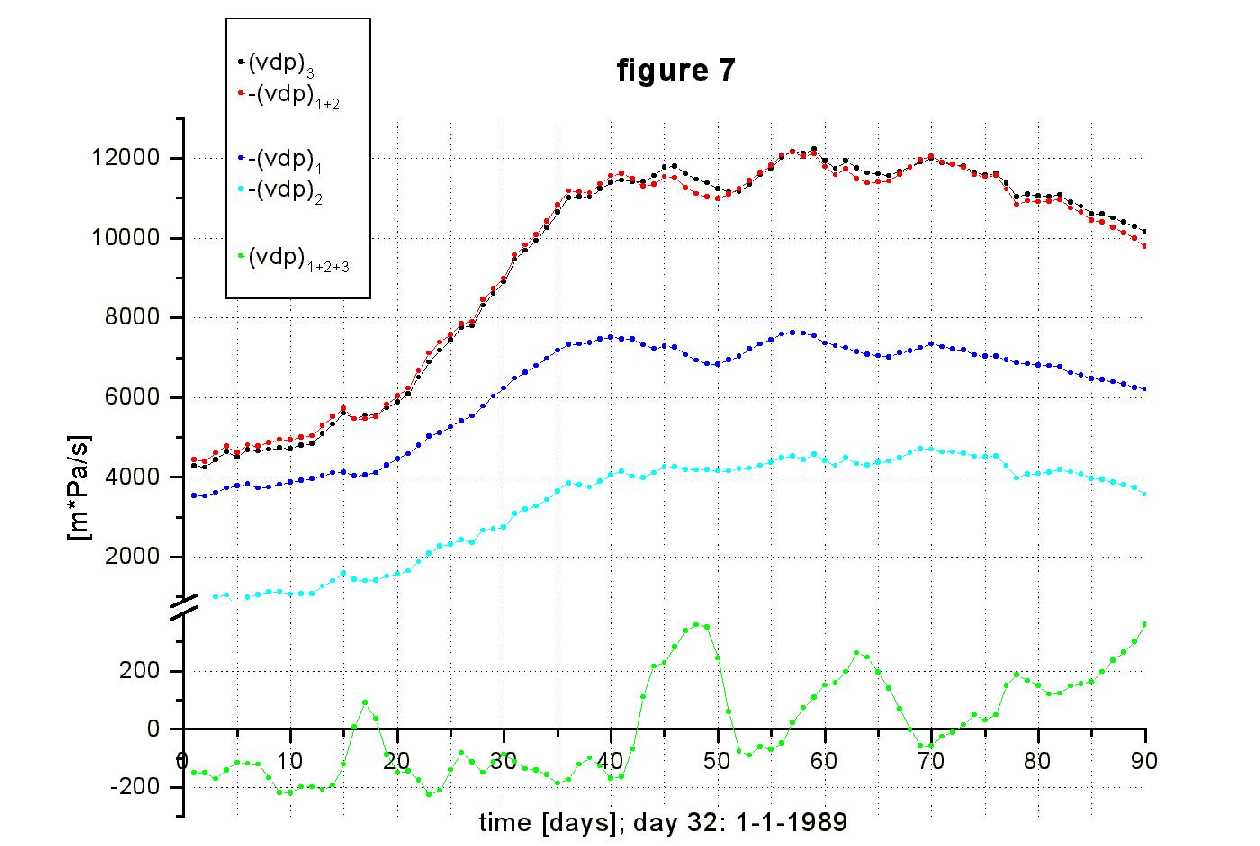
Figure 7: The low-pass filtered time series of the meridional wind at 60Ž N integrated over different layers (as defined in Fig. 3). The largest fluctuations in the equatorward flow occur in the stratosphere (layer 1). 'p0,pcm/'t is proportional to (vdp)1+2+3. v1 and v2 induce a lower tropospheric poleward flow (v3), which slightly lags the upper equatorward flow, leading to a negative 'p0,pcm/'t when -v1+2 and v3 increase and a positive 'p0,pcm /'t when -v1+2 and v3 decrease.
STEP 3:
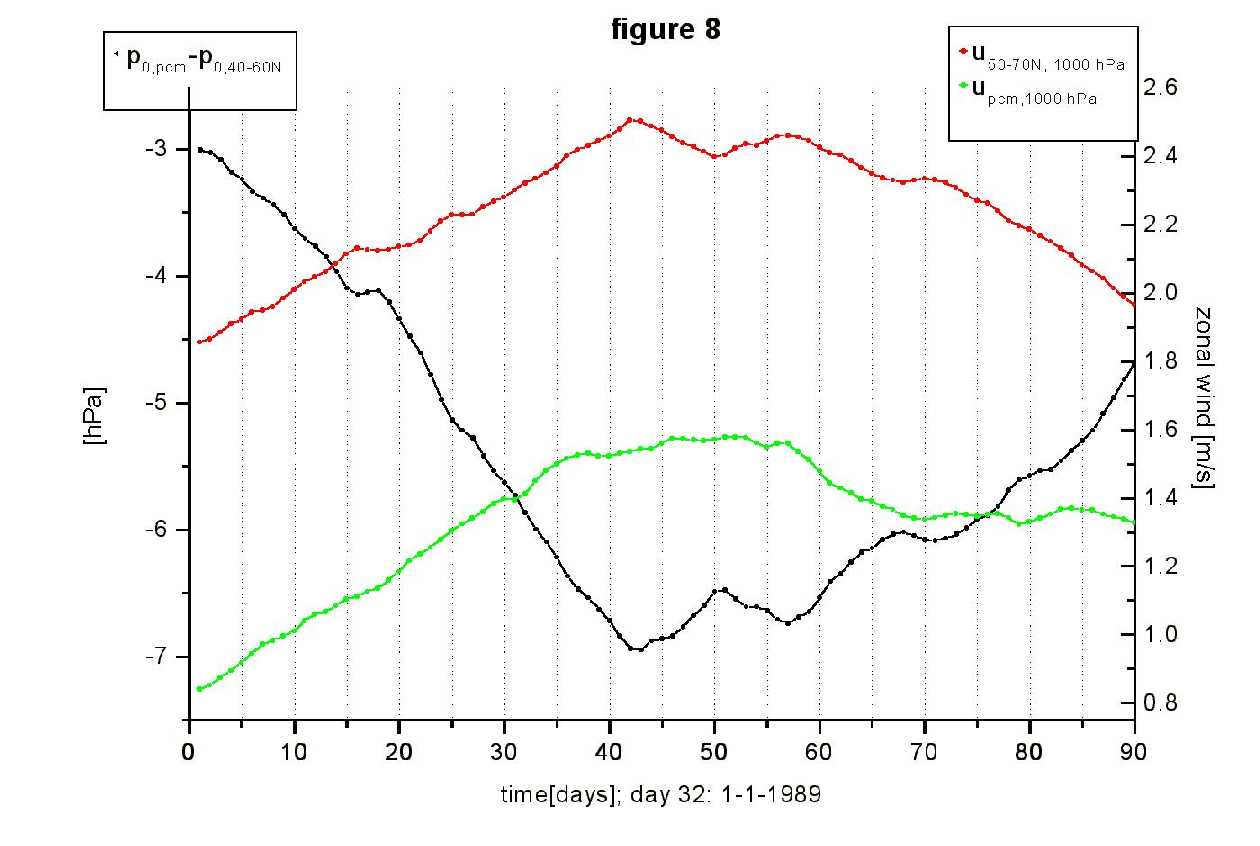
Figure 8: The low-pass filtered time series of upcm and u between 50-70ƒ N, both at 1000 hPa, and the difference between p0,pcm and p0 averaged between 40-60ƒ N. Variations in the meridional pressure gradient around 60ƒ N coincide with variations in the surface zonal wind around 60ƒ N and thus in upcm near the surface.
STEP 4:
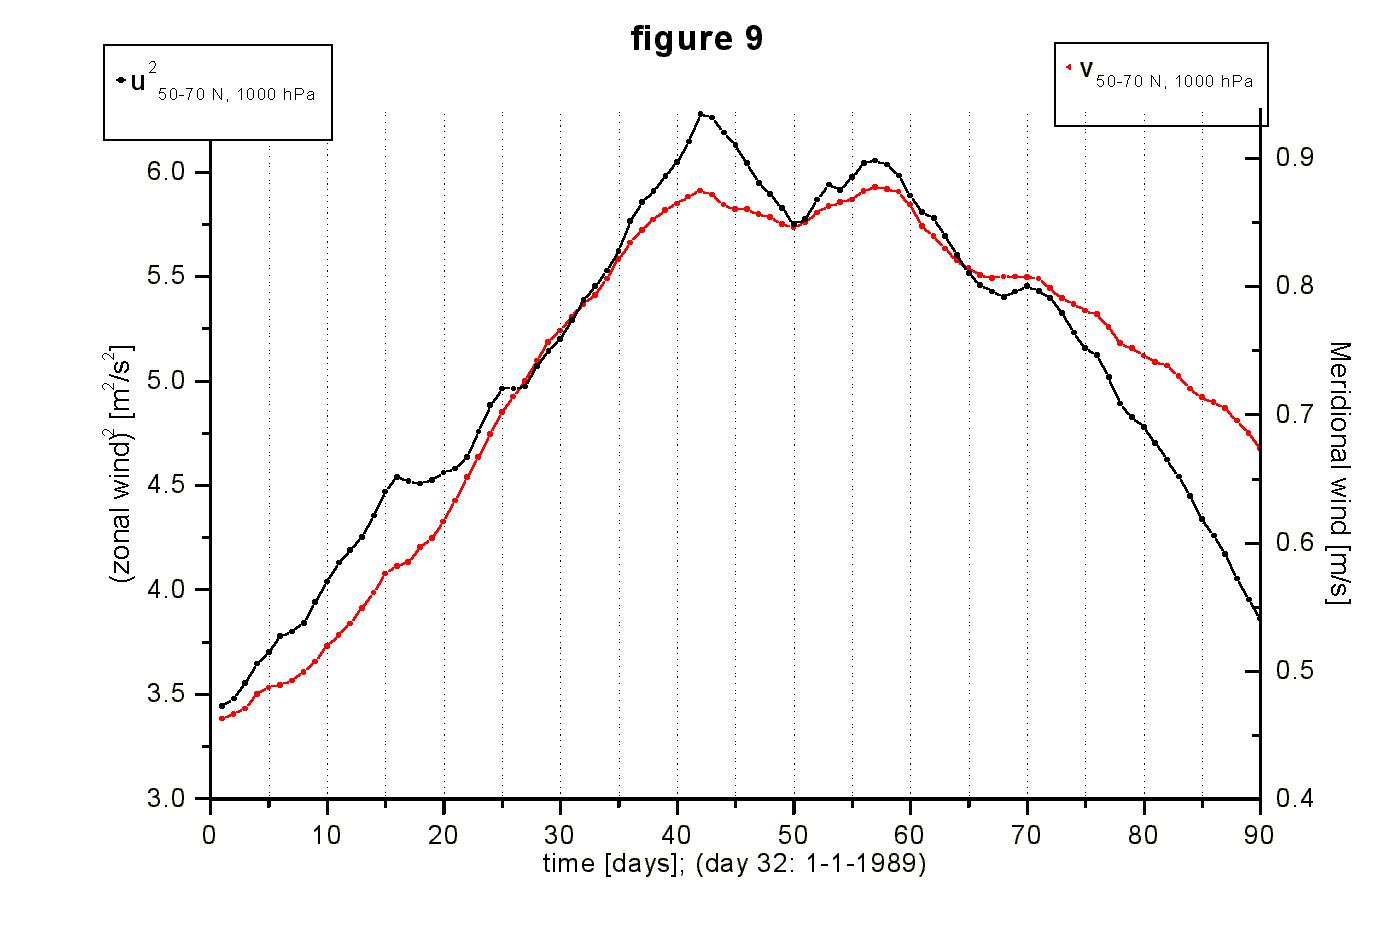
Figure 9: The low-pass filtered time series of v and u2, both averaged between 50-70ƒ N, at 1000 hPa. Since the Coriolis force Fc and the zonal frictional force Fw are proportional to v and u2, respectively, the almost constant ratio between v and u2 indicates a balance between Fw and Fc .
6. Conclusions:
This study has given evidence for the following aspects of the hypothesized mechanism:
- Downward propagation of low-frequent u and Fm variations in the stratosphere.
- All four steps of the downward propagation from the lower stratosphere to the lower troposphere.
The hypothesis therefore seems to be valid, at least for NH winter 1988-89.
7. References:
Baldwin, M. P. and Dunkerton, T. J. 1999. Propagation of the Arctic Oscillation from the stratosphere to the troposphere. J. of Geophys. Res. 104, 30937-30946.
Peixoto, J. P. and Oort, A. H. 1992, Physics of climate, AIP Press, 520pp.
Thompson, D. W. J., and Wallace, J. M. 1998. The Arctic Oscillation signature in the wintertime geopotential height and temperature fields. Geophys. Res. Lett. 25, 1297-1300.
Back to
| Session 1 : Stratospheric Processes and their Role in Climate | Session 2 : Stratospheric Indicators of Climate Change |
| Session 3 : Modelling and Diagnosis of Stratospheric Effects on Climate | Session 4 : UV Observations and Modelling |
| AuthorData | |
| Home Page | |
Ý