Previous: Analysis I: Downward propagation in the stratosphere Next: Conclusions Up: Ext. Abst.
5. Analysis II: Downward propagation from the lower stratosphere to the lower troposphere
STEP 1:
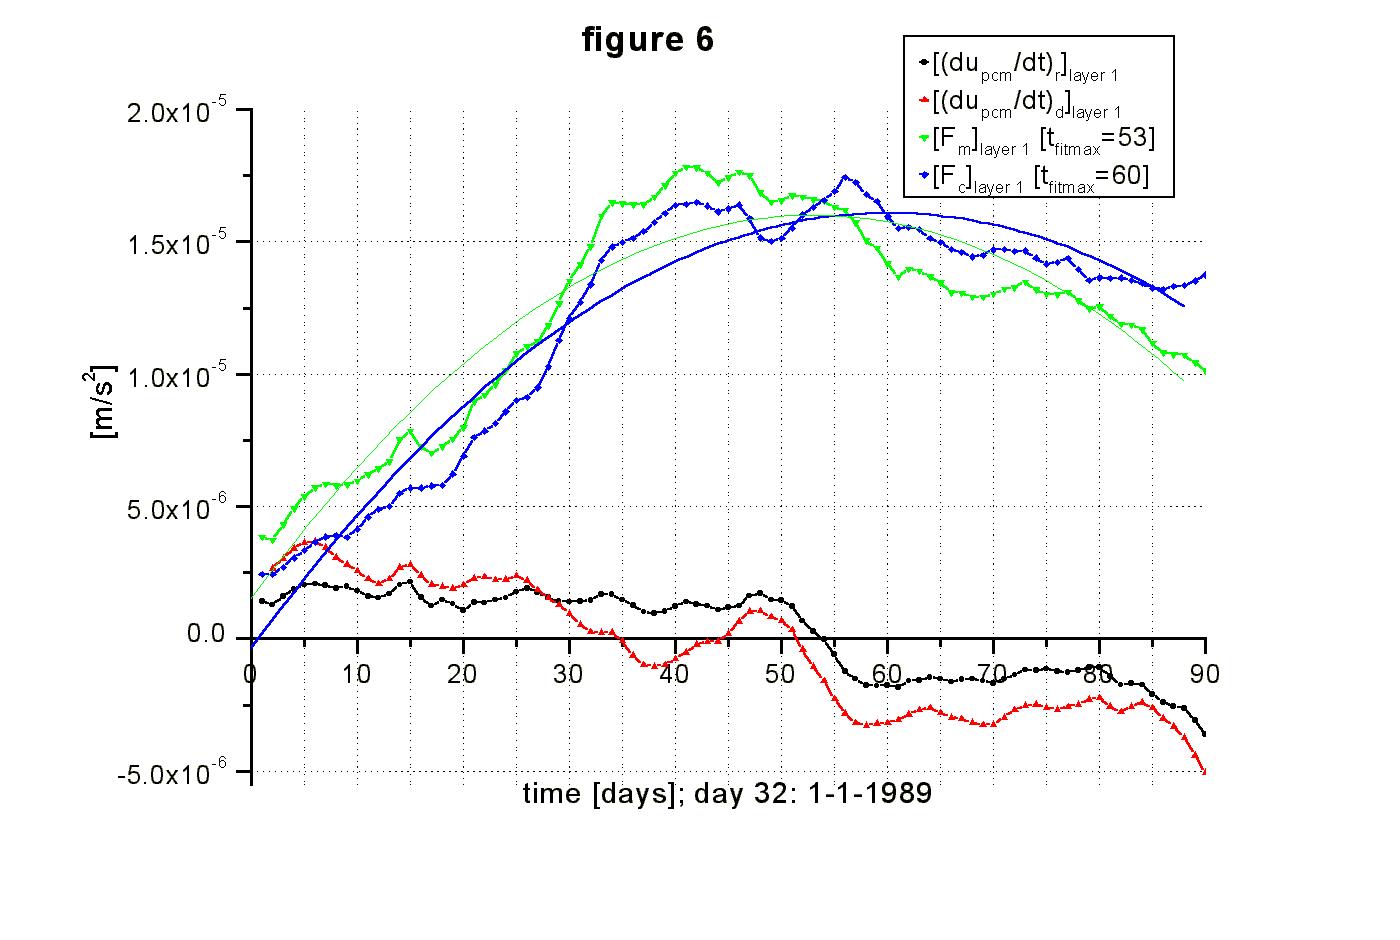
Figure 6: The low-pass filtered time series of ('upcm/'t)r, ('upcm/'t)d, Fm and -Fc averaged over layer 1 (as defined in Fig. 3). Ultra-low frequent variations in Fm are followed by similar variations in -Fc after one week, leading to a positive 'upcm/'t in the first part of the winter when Fm and -Fc increase and a negative 'upcm/'t in the second part of the winter when Fm and -Fc decrease. Fm seems to induce an equatorward flow in the stratosphere after one week, which associated zonal Coriolis force counteracts Fm.
STEP 2:
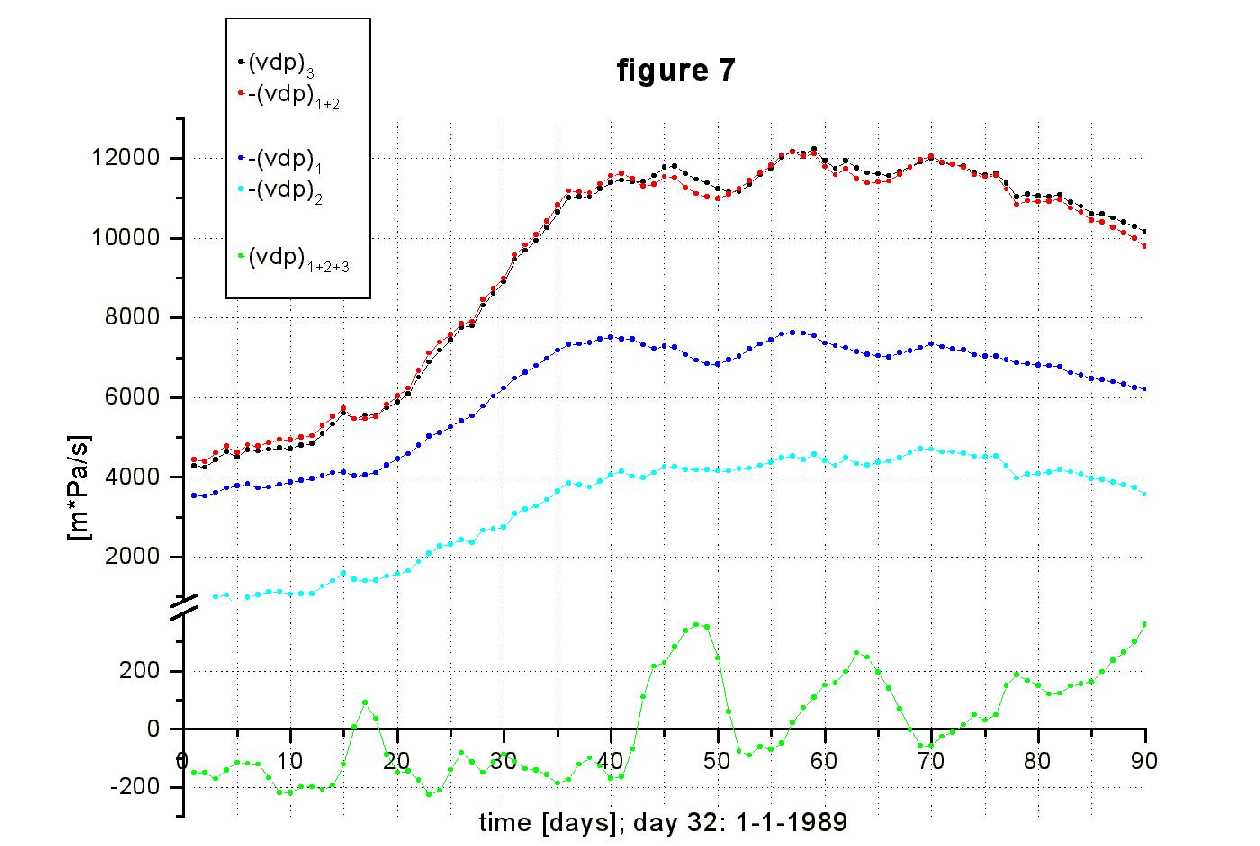
Figure 7: The low-pass filtered time series of the meridional wind at 60Ú N integrated over different layers (as defined in Fig. 3). The largest fluctuations in the equatorward flow occur in the stratosphere (layer 1). 'p0,pcm/'t is proportional to (vdp)1+2+3. v1 and v2 induce a lower tropospheric poleward flow (v3), which slightly lags the upper equatorward flow, leading to a negative 'p0,pcm/'t when -v1+2 and v3 increase and a positive 'p0,pcm /'t when -v1+2 and v3 decrease.
STEP 3:
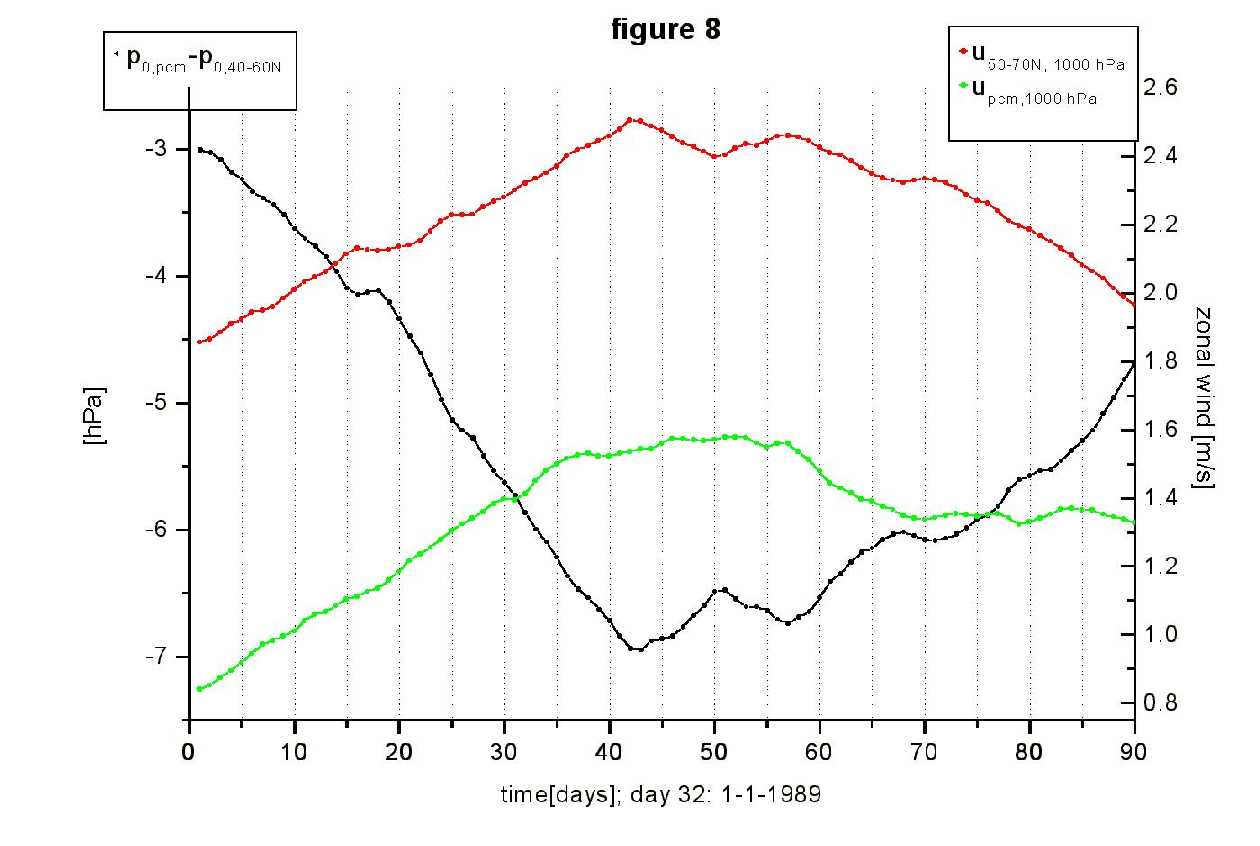
Figure 8: The low-pass filtered time series of upcm and u between 50-70° N, both at 1000 hPa, and the difference between p0,pcm and p0 averaged between 40-60° N. Variations in the meridional pressure gradient around 60° N coincide with variations in the surface zonal wind around 60° N and thus in upcm near the surface.
STEP 4:
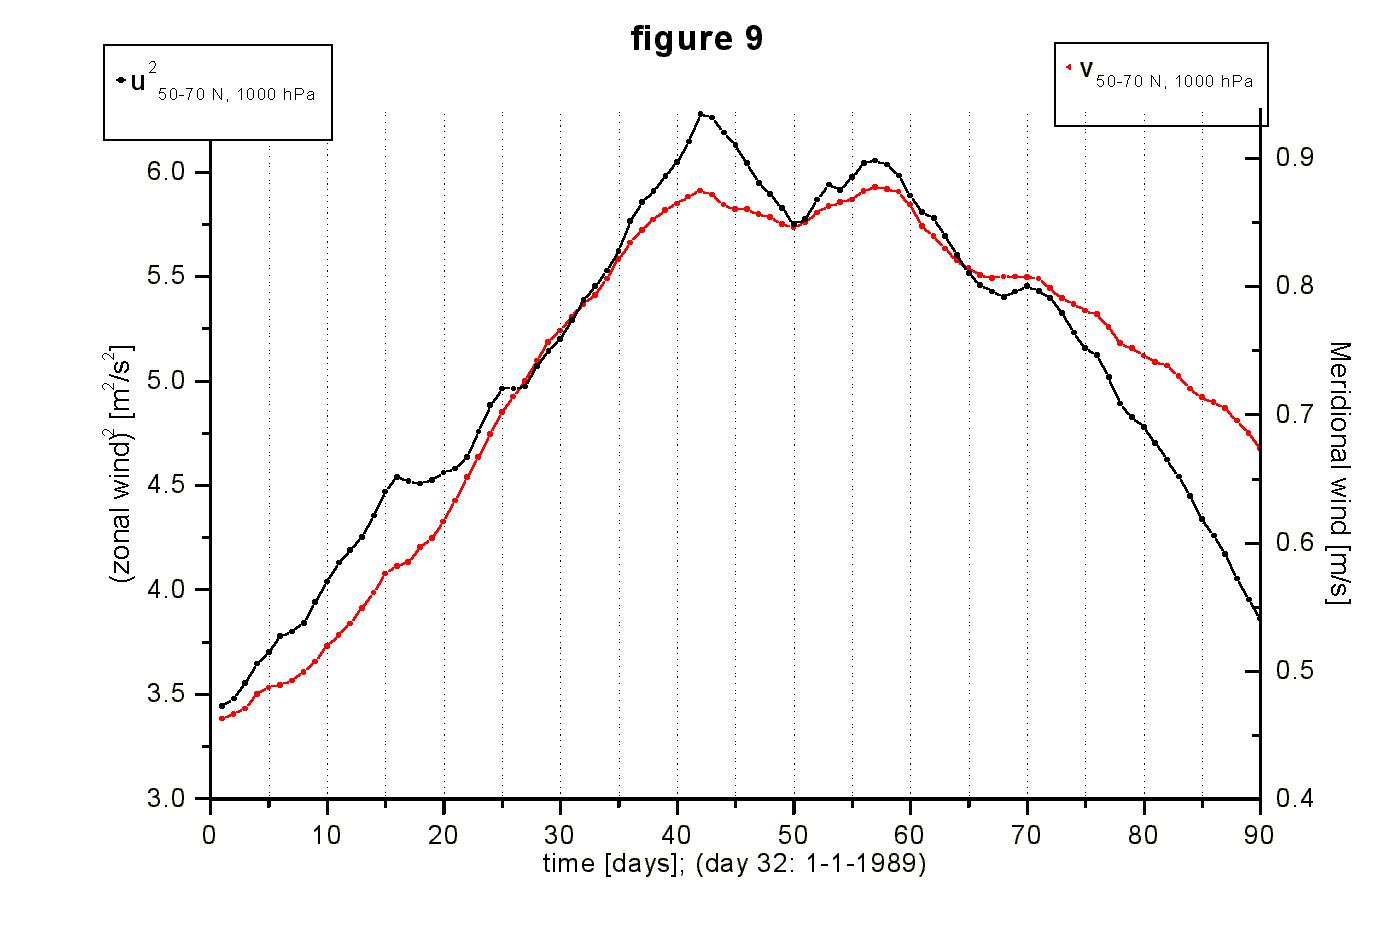
Figure 9: The low-pass filtered time series of v and u2, both averaged between 50-70° N, at 1000 hPa. Since the Coriolis force Fc and the zonal frictional force Fw are proportional to v and u2, respectively, the almost constant ratio between v and u2 indicates a balance between Fw and Fc .