Previous: Method Next: Conclusions Up: Ext. Abst.
Results
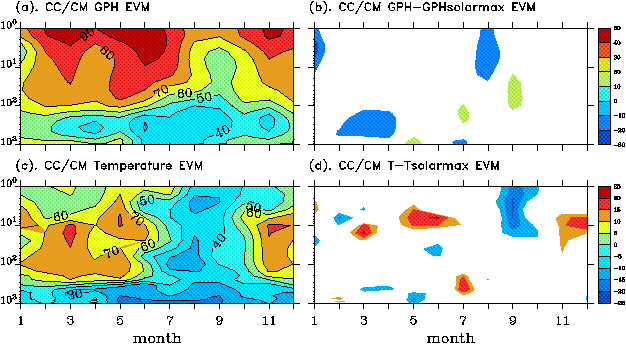
For our analysis we used variables monthly means. The eigenvalue maps (EVMs) for GPH and temperature for the UIUC CC/CM control run are presented in Fig. 1 (a and b).
Figure 1: UIUC CC/CM EVM (%) for GPH (a) and temperature (b), and difference EVM (%) for GPH (c) and temperature (d) between control and experimental 15-year runs. In (c) and (d) the magnitudes of the differences less than 10% are masked.
For comparison, the EVMs for the NCEP and UKMO reanalysis data are presented in Fig. 2.
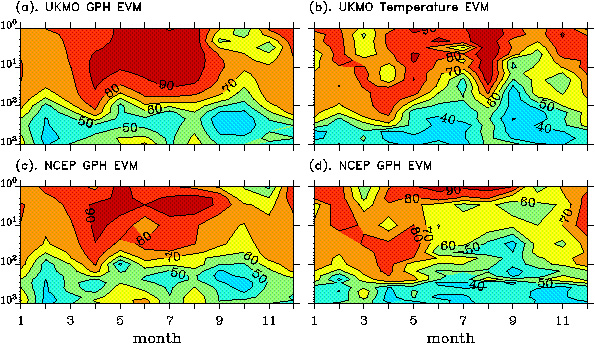
Figure 2: UKMOEVM (%) for GPH (a) and temperature (c); and NCEPEVM (%) for GPH (b) and temperature (d)
In general all three data sets show a correspondence. The main feature for the geopotential height is the strong dominance of the first mode in the stratosphere for most of the year, with exceptions in August-October for UIUC CC/CM (Fig. 1a) in the lower stratosphere and September-November for UKMO (Fig. 2a) and NCEP (Fig. 2b) in the upper stratosphere. For temperature, the UIUC CC/CM data (Fig. 1c) show a greater similarity with the NCEP (Fig. 2d) data than the UKMO data (Fig. 2c), with dominance of the first mode during January-May in the stratosphere and a reduction therein (stronger for the UIUC CC/CM) during June-October. The UKMO data (Fig. 2c) show the dominance of the first temperature mode in the stratosphere during almost the entire year.
Figures 3a and 3b are the EVMs for ozone and methane from the 15-year control run of the UIUC CC/CM. Figure 3c is the EVM for ozone from the ACTM run with the wind field prescribed from the UKMO reanalysis dataset. Comparison of Fig. 1 (a and b) and Fig. 3 (a and b) shows that in the middle and lower stratosphere the UIUC CC/CMâ?™s ozone EVM (Fig. 3a) corresponds more to the temperature EVM (Fig. 1b) than to the GPH EVM (Fig. 1a), while in the upper stratosphere the ozone EVM (Fig. 3a) corresponds more to the GPH EVM (Fig. 1a) than to the temperature EVM (Fig. 1b). The methane EVM (Fig. 3b) corresponds to the GPH EVM only in the summer months in the upper and middle stratosphere. Figure 3c shows that the EVM for ozone calculated by the ACTM without feedbacks on the circulation and temperature reveals less deviation from the climatological mean than does the ozone calculated by the UIUC CC/CM, especially in the lower stratosphere and upper troposphere.
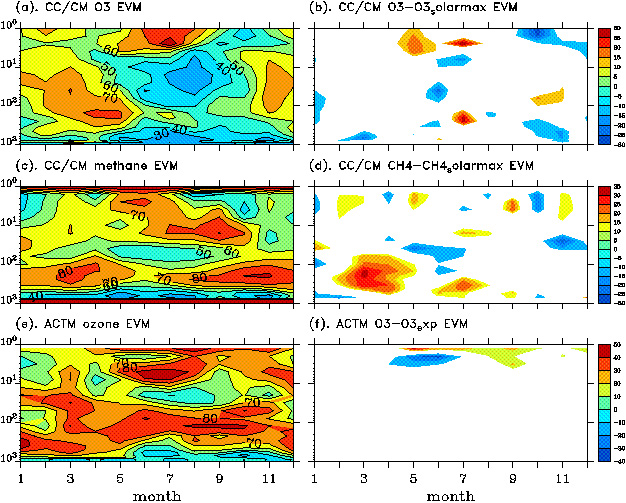
Figure 3: UIUC CC/CM EVM (%) for ozone (a) and methane (b), difference EVM (%) for ozone (d) and methane (e) between control and experimental 15-year runs; and ACTM EVM (%) for ozone and its difference EVM (%) between control and experimental 6-year ACTM runs. In (d), (e) and (f) the magnitudes of the differences less than 10% are masked
We determined the change in the EVMs for the first modes of temperature, GPH, ozone and methane resulting from the two experiments . Figures 3d and 3e show the difference between the EVMs for the control run of the UIUC CC/CM with the observed average spectrum of solar radiation and the experiment run of the UIUC CC/CM with the observed increase in solar UV radiation from solar minimum to solar maximum added to the average spectrum of solar radiation. The increased solar UV radiation influenced both the solar heating rates in atmosphere and the photolysis rates in the atmospheric chemical reactions. Figure 1 (c and d) shows the corresponding changes in the GPH EVM (Fig. 1c) and temperature EVM (Fig. 1d). Figure 3f shows the change in the ozone EVM due to the 3% per year change in surface sources of CFCâ?™s calculated by the ACTM with the UKMO reanalysis winds. On all these figures, positive values mean that the role of the first mode is diminished due to the change in boundary condition, either the solar radiation at the top of the atmosphere or the CFC source at the bottom of the atmosphere. For clarity, all changes less than 10% are not shown in the difference maps.
For the difference between the UIUC CC/CM runs (Figures 1c, 1d, 3d and 3e), the positive and negative changes in the EVM are rather significant over the entire atmosphere for all four quantities. For the ACTM runs (Fig. 3f), the changes in the ozone EVM are significant only in the upper atmosphere. For the winter atmosphere where the AO dominates the interannual variability pattern, the change in solar radiation input reduces the dominance of the first mode for GPH and methane above 10 hPa, and for all four quantities around 100 hPa.
Figure 4 shows the relation between the first mode of climate and chemical variables for January at 4 hPa and 100 hPa. It can be seen (Fig. 4a) that for this point in time and space, the positive correlation between GPH and methane is considerably increased for the UIUC CC/CM solar maximum run in comparison with its control run. This suggests that here as a result of the increase of the input solar radiation the role of planetary-wave activity for methane increased. Figure 4 (b and c) shows the variability of the first modes for GPH and methane for all 15 years. It can be seen that in the "solarmax" UIUC CC/CM run the amplitude of the first mode and the synchronicity in the variation between methane and GPH increased in comparison with control run. Both variables show a quasi-two-year oscillation in the "solarmax" run. Figure 4d shows the correlation of the first modes of methane and ozone for January at 100 hPa. It can be seen that the anti-correlation between ozone and methane in the "solarmax" experiment increased in comparison with control run. Figures 4 (e and f) show that the amplitude of the variation of both quantities in the "solarmax" run also increased. Figure 4g demonstrates a strong correlation between GPH and ozone at 100 hPa, which slightly decreases in the "solarmax" run. We conclude that the interannual variation in methane and ozone at 100 hPa has both a chemical and dynamical cause. It can be noted from Fig. 4h that an increase in the input solar radiation slightly changes the variability of GPH at 100 hPa, making it closer to the quasi-two-year period.
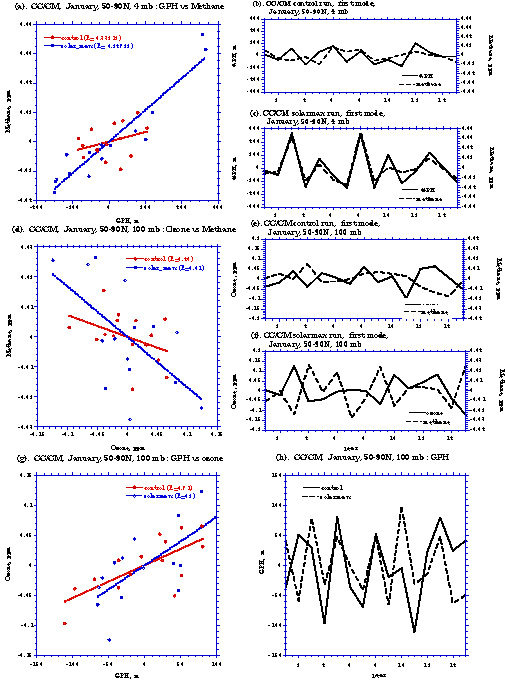
Figure 4: TheUIUC CC/CM January first mode calculated over 50°N-90°N region over 15-years model runs: (a). GPH (m) vs methane (ppm) at 4 hPa model level for the control and solar maximum experiments; (b). 15-year evolution of the first mode for GPH and methane for the control run at 4 hPa; (c). the same as (b) only for the solar maximum experiment; (d) ozone (ppm) vs methane (ppm) at 100 hPa model level for the control and solar maximum experiments; (e). 15-year evolution of the first mode for ozone and methane at 100 hPa for the control run; (f). the same as (e) for solar maximum run; (g) ozone (ppm) vs GPH (m) at 100 hPa model level for the control and solar maximum experiments; (h) 15-year evolution of the first mode for GPH at 100 hPa for the control and solar maximun experiments