E.A.R.T.H Center, Departamento de Fisica, Universidad Técnica
Federico Santa Maria, Casilla 110V, Valparaíso, Chile.
ldasilva@fis.utfsm.cl
FIGURES
Abstract
Data on the ozone column published by NASA since 1978 show a clear decrease every summer in the ozone column along the west coast of South America, extending from Ecuador southward to approximately 33º latitude in Chile. The occurrence of these seasonal declines is further supported by Dobson data from the Instituto Geofisico at Huancayo (12º 02’ S, 75º 19’ W), Peru (Figures 5-6), and UV solar radiation data from the observatory at El Tololo (33º 23’ S, 70º 47’ W), Chile. To determine the characteristics of this phenomenon, satellite data were used to obtain cross-sections of the ozone column. When graphed, they revealed a significant decline in the concentration of the column in the form of a depleted strip flanked by asymmetric areas of normal concentration. To find the cause of this depletion, an analysis was made of the regional wind field velocities and their vorticities at different heights. This produced evidence that the ozone layer is being compressed by winds coming from above and winds moving upward from the troposphere, causing a redistribution in ozone density.
Introduction
Since 1978, data publicly available from NASA show that during the summer of each year a decrease in the total ozone column appears over the West coast of South America, extending from Ecuador to approximately 33ºS latitude in Chile. This depletion takes the form of a strip located between the Andes mountain range and the Pacific coast. At these latitudes, ozone concentration averages on the order of 270 DU, but when the aforementioned depletion occurs this figure can fall as low as 230 DU. The process by which the depletion arises indicates that the strip may begin in Ecuador and stretch southward down the Pacific coast, passing along the western edge of Peru and arriving as far as 33ºS in Chile. [1]
Analysis of the Data
Information on the decreases in the total ozone column over the West coast of South America have been available since 1978, and the decreases have been detected principally during the summer season in the southern hemisphere [2]. There exist some cases of decreases in the same region at other times of the year, but only in sporadic fashion. In figure 1, the depletion is shown for January 2, 1988. To analyse the depletion in greater detail a latitudinal sweep was carried out, with cross-sections taken every 0.5º between the latitudes 0.5ºS and 30.5ºS and longitudes 40.625ºW and 115.625ºW. The results are shown in figure 2, and indicate that the depleted area in the total ozone column takes the shape of a trough or furrow. The ozone decrease is sharp, displaying an approximate depth of between 20 and 40 UD with respect to the immediately surrounding maxima. The diagram also confirms that the areas flanking the trough are asymmetrical in relation to it.
Figure 1. Map of the distribution of stratospheric ozone, showing the depletion of the ozone column over the west coast of South America, January 2, 1998.

Figure 2. Latitudinal cross-sections taken every 0.5º, showing the decrease in ozone flanked by asymmetrically distributed areas of higher ozone density.
The ozone concentration on the Pacific side is low in the northern region and increases as one moves southward, while on the Andes side the situation is just the reverse. The transition point in this asymmetry occurs at about 15ºS.
The depletion in the total ozone column is an anomaly whose existence
is undoubtedly due, in part, to the presence of the Andes, a mountain
range stretching along the west side of South America parallel
to the Pacific coast whose peaks reach an elevation approximately
6,000 m above sea level. Furthermore, at certain times of the
year eastern winds arrive from the Brazilian plains, and on coming
into contact with the natural barrier formed by the Andes strong
disturbances are produced which may also affect the ozone distribution.
Because of this, it was decided to analyse the winds’ velocity
fields at various elevations in an area bounded by Ecuador to
the north, latitude 33ºS to the south, longitude 50ºW to the east
and longitude 90ºW to the west.
The direction and magnitude of the wind velocities were analysed
in the horizontal plane in the area of the ozone depletion. The
data on horizontal velocity were constructed on the basis of data
from the NCEP/NCAR Reanalysis CD [3]. Figure 3 below shows a map
of wind velocity fields in the above-mentioned area for January
2, 1988 at various elevations: 200 hPa, 100 hPa, 50 hPa and 20
hPa. At 200 hPa the horizontal components of the wind velocities
constitute a counterclockwise vorticity centred over southern
Peru (15ºS by 57ºW). At 100 hPa the configuration still holds,
with an area of low horizontal velocity observed over the Andes.
At 50 hPa a long stretch of winds moving towards the west are
observed as well as some vorticity in the northern zone, but the
latter is now in a clockwise direction. This situation is maintained
at 20 hPa.
Figure 3. Map of wind velocity fields at various heights, showing vorticities of these winds on January 2, 1988.
To determine precisely whether the winds produced by these vorticities
are moving upwards or downwards, graphs of the vorticities were
constructed for the various heights, and are displayed here in
figure 4. The arrows show the direction of the vorticities, and
the scale of colours indicate their magnitude. At 20 hPa in the
northern zone, the graphs reveal the existence of winds with velocities
whose vertical components move downwards over a wide area in which
ozone depletion is present. At 50 hPa the centre of vorticity
has moved southward, while remaining over the slopes of the Andes.
At 100 hPa, on the other hand, the vorticity changes direction,
indicating that the winds have velocities whose vertical component
moves upwards. This continues to hold at 200 hPa, and in the latter
case a vorticity in the whole of the ozone depletion zone is clearly
noticeable.
Figure 4. Map of vorticities at various heights, showing changes in the direction of vorticity as a function of the height, January 2, 1988.
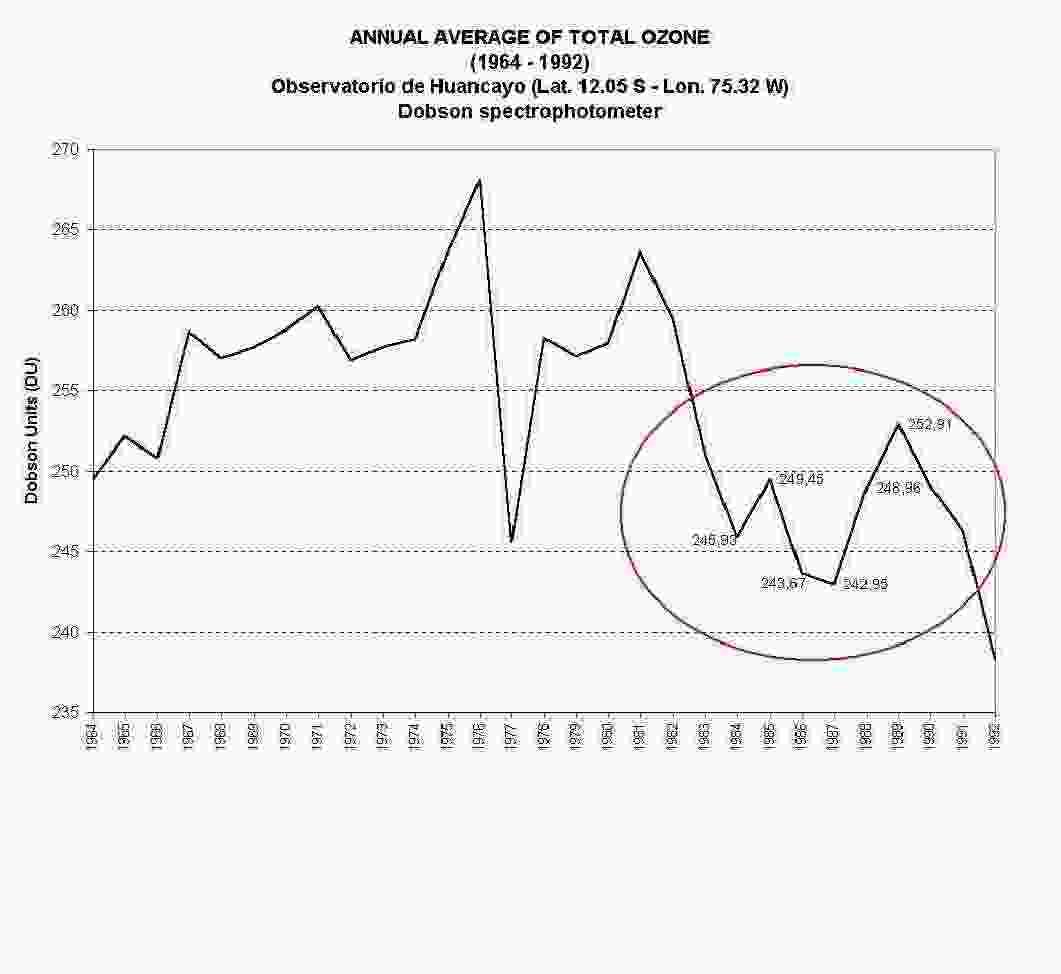
Figure 5. Annual average of total ozone (1964-1992). Observatorio de Huancayo (Lat.12º 02’ S, Lon. 75º 19’ W). Dobson Spectrophotometer
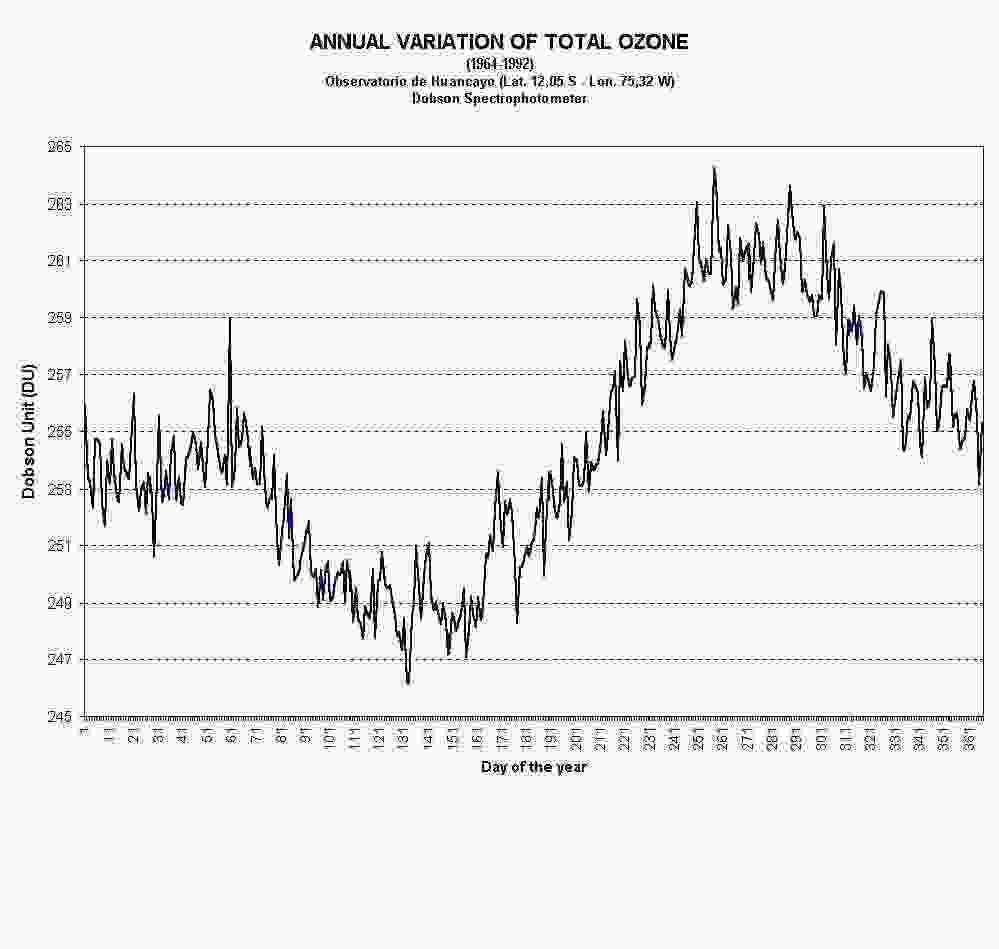
Figure 6. Annual variation of total ozone (1964-1992). Observatorio de Huancayo (Lat.12º 02’ S, Lon. 75º 19’ W). Dobson Spectrophotometer..
Conclusion and comments
This study provides evidence that the seasonal decreases in the total ozone column over the West coast of South America originate in the circulation of winds at various elevations in the affected region. This circulation generates one vorticity which pushes air upwards from below the ozone layer, and another vorticity which pushes air down from above, thus compressing the layer and producing a redistribution in its density, which results in the observed ozone decrease over the region in question. The reason this occurs mainly in summer has to do with the wind patters that create the vorticities which in turn account for the ozone decreases. It has been noted that the minimum ozone densities occur over the Andes mountain peaks, leading some authors to claim them as the cause of a thinner ozone layer [4]. It is possible that they contribute to the depletion, but this does not explain the fact that the phenomenon occurs mainly in the southern hemisphere summer.
Acknowledgements
I would like to express my thanks to Dr. Paul Crutzen for having encouraged me to undertake this investigation, and to Arnaldo Torres, meteorologist, and Danilo Araya, engineer, both for their collaboration in preparing the vorticity maps and ozone column profiles and for their valuable comments which helped to improve this study. I am also grateful for the support of the Dirección General de Investigación y Postgrado of the Universidad Técnica Federico Santa María, and of the CYTED Project in Spain. Finally, I wish to thank the Dirección Meteorológica de Chile for its collaboration in supplying data from its network of UV radiation stations.
References
[1] L. Da Silva, D. Araya. “The ozone layer depletion on the west border of South America” Workshop: Understanding Stratospheric Ozone and UV-B Radiation. Departamento de Ciencias de la Atmósfera, Universidad de Buenos Aires, Argentina. March 9-11, 1998.
[2] Nimbus-7 TOMS Data & Images. Data Record 11/01/1978 - 05/06/1993. Meteor-3 TOMS Data & Images. Data Record :08/22/ 1991 - 11/24/1994. ADEOS TOMS Data & Images. Data Coverage : 09/11/1996 - 06/29/1997. Earth Probe TOMS Data & Images. Data Coverage : 07/25/1998 - Present.
[3] NCEP/NCAR Reanalysis, Global Atmospheric Analysis, various years. National Centers for Environmental Prediction, Washington DC and National Center for Atmospheric Research, Boulder, CO, USA.
[4] Emilio Cuevas, Manuel Gil, José Rodríguez, J.M. Sancho. “El efecto GHOST (Global Hidden Ozone Structures from TOMS): posibles implicaciones dinámicas” IV Simposio Nacional de Predicción. Memorial “Alfonso Ascaso”. Madrid, España. April 15-19, 1996.
Back to
| Session 1 : Stratospheric Processes and their Role in Climate | Session 2 : Stratospheric Indicators of Climate Change |
| Session 3 : Modelling and Diagnosis of Stratospheric Effects on Climate | Session 4 : UV Observations and Modelling |
| AuthorData | |
| Home Page | |