Previous: Introduction Next: Conclusion and comments Up: Ext. Abst.
Analysis of the Data
Information on the decreases in the total ozone column over the West coast of South America have been available since 1978, and the decreases have been detected principally during the summer season in the southern hemisphere [2]. There exist some cases of decreases in the same region at other times of the year, but only in sporadic fashion. In figure 1, the depletion is shown for January 2, 1988. To analyse the depletion in greater detail a latitudinal sweep was carried out, with cross-sections taken every 0.5º between the latitudes 0.5ºS and 30.5ºS and longitudes 40.625ºW and 115.625ºW. The results are shown in figure 2, and indicate that the depleted area in the total ozone column takes the shape of a trough or furrow. The ozone decrease is sharp, displaying an approximate depth of between 20 and 40 UD with respect to the immediately surrounding maxima. The diagram also confirms that the areas flanking the trough are asymmetrical in relation to it.
Figure 1. Map of the distribution of stratospheric ozone, showing the depletion of the ozone column over the west coast of South America, January 2, 1998.
Figure 2. Latitudinal cross-sections taken every 0.5º, showing the decrease in ozone flanked by asymmetrically distributed areas of higher ozone density.
The ozone concentration on the Pacific side is low in the northern region and increases as one moves southward, while on the Andes side the situation is just the reverse. The transition point in this asymmetry occurs at about 15ºS.
The depletion in the total ozone column is an anomaly whose existence
is undoubtedly due, in part, to the presence of the Andes, a mountain
range stretching along the west side of South America parallel
to the Pacific coast whose peaks reach an elevation approximately
6,000 m above sea level. Furthermore, at certain times of the
year eastern winds arrive from the Brazilian plains, and on coming
into contact with the natural barrier formed by the Andes strong
disturbances are produced which may also affect the ozone distribution.
Because of this, it was decided to analyse the winds’ velocity
fields at various elevations in an area bounded by Ecuador to
the north, latitude 33ºS to the south, longitude 50ºW to the east
and longitude 90ºW to the west.
The direction and magnitude of the wind velocities were analysed
in the horizontal plane in the area of the ozone depletion. The
data on horizontal velocity were constructed on the basis of data
from the NCEP/NCAR Reanalysis CD [3]. Figure 3 below shows a map
of wind velocity fields in the above-mentioned area for January
2, 1988 at various elevations: 200 hPa, 100 hPa, 50 hPa and 20
hPa. At 200 hPa the horizontal components of the wind velocities
constitute a counterclockwise vorticity centred over southern
Peru (15ºS by 57ºW). At 100 hPa the configuration still holds,
with an area of low horizontal velocity observed over the Andes.
At 50 hPa a long stretch of winds moving towards the west are
observed as well as some vorticity in the northern zone, but the
latter is now in a clockwise direction. This situation is maintained
at 20 hPa.
Figure 3. Map of wind velocity fields at various heights, showing vorticities of these winds on January 2, 1988.
To determine precisely whether the winds produced by these vorticities
are moving upwards or downwards, graphs of the vorticities were
constructed for the various heights, and are displayed here in
figure 4. The arrows show the direction of the vorticities, and
the scale of colours indicate their magnitude. At 20 hPa in the
northern zone, the graphs reveal the existence of winds with velocities
whose vertical components move downwards over a wide area in which
ozone depletion is present. At 50 hPa the centre of vorticity
has moved southward, while remaining over the slopes of the Andes.
At 100 hPa, on the other hand, the vorticity changes direction,
indicating that the winds have velocities whose vertical component
moves upwards. This continues to hold at 200 hPa, and in the latter
case a vorticity in the whole of the ozone depletion zone is clearly
noticeable.
Figure 4. Map of vorticities at various heights, showing changes in the direction of vorticity as a function of the height, January 2, 1988.
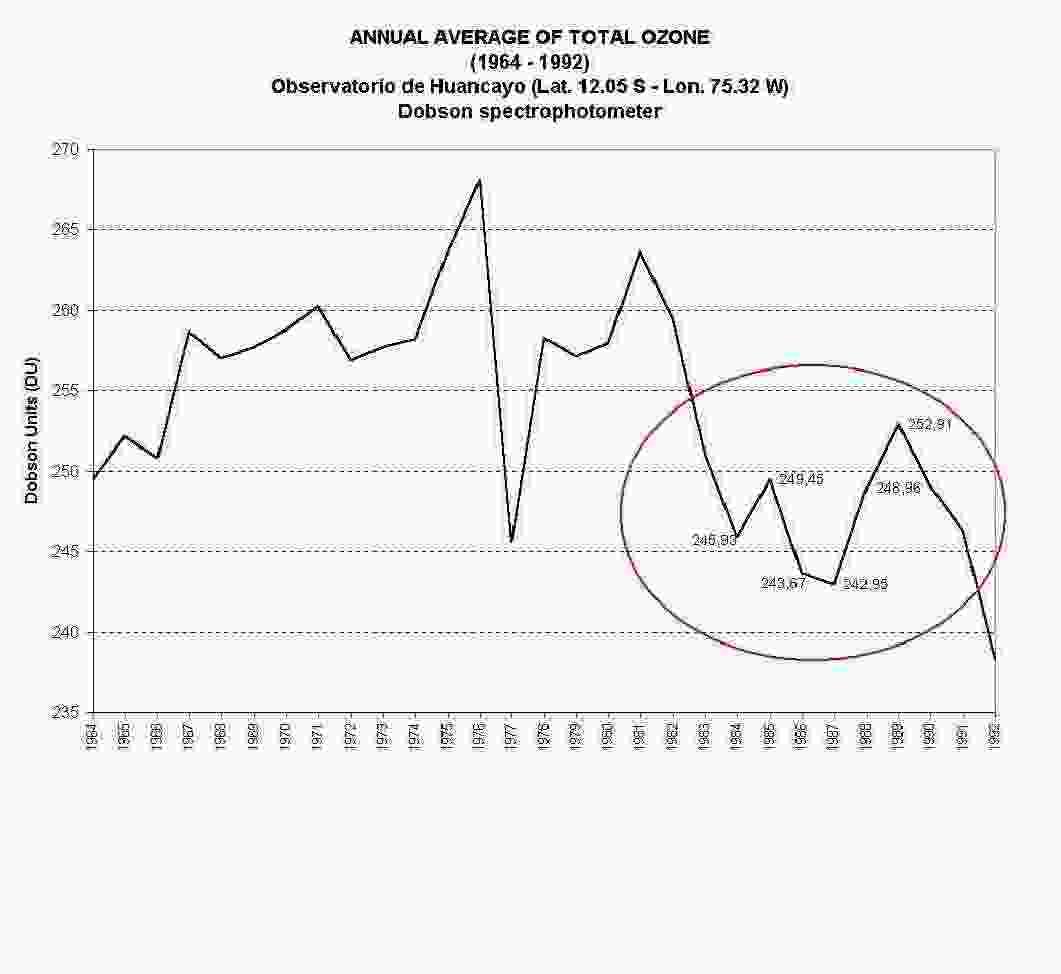
Figure 5. Annual average of total ozone (1964-1992). Observatorio de Huancayo (Lat.12º 02’ S, Lon. 75º 19’ W). Dobson Spectrophotometer
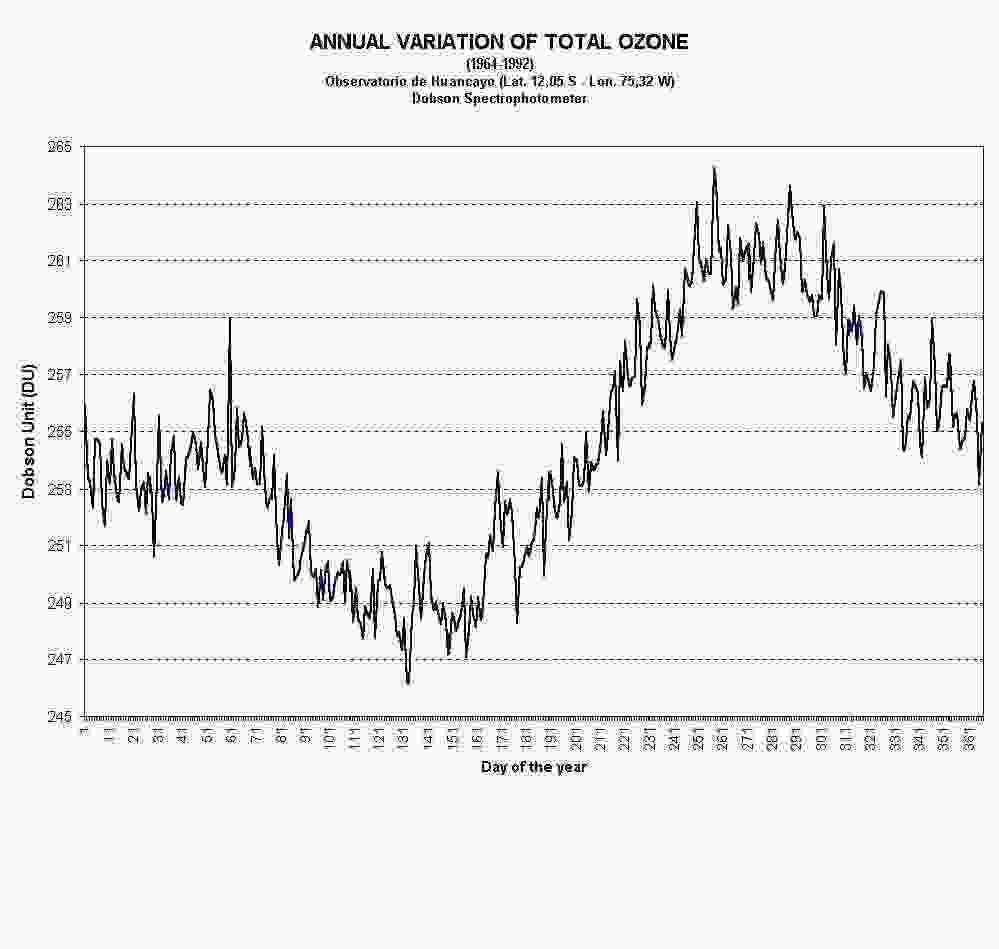
Figure 6. Annual variation of total ozone (1964-1992). Observatorio de Huancayo (Lat.12º 02’ S, Lon. 75º 19’ W). Dobson Spectrophotometer..