
Previous: Introduction Next: Daily variations of total ozone and the surface ozone concentration Up: Ext. Abst
Annual variations of total ozone and the surface ozone concentration
The back-ground measurements of total ozone and the surface ozone concentration were used for investigation of ozone variations. Spectrophotometer-ozonometer, constructed on double quartz monochromator, has been used to spectral the measurements of total ozone [Bekturganov et. al.,1977].
Total ozone was calculated by the multi-wavelength's technique
[Kuznetsov, 1975].
Value of the surface ozone concentration was carried out by standart
hemiluminiscence ozonometer.
Month-mean value of total ozone and the surface ozone concentration
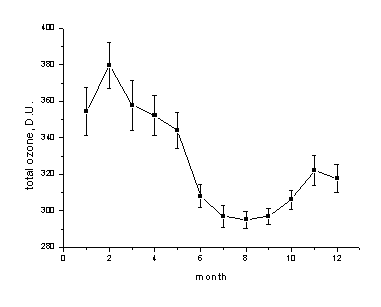
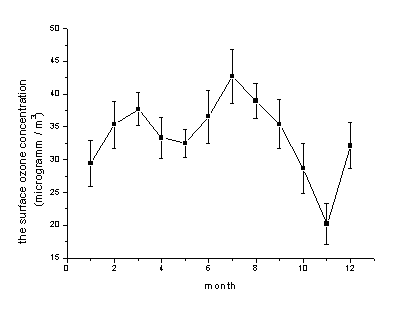
was calculated over the years 1993-1997. Figure 1 for total ozone
and figure 2 for the surface ozone concentration shows the annual
cycle of calculated values.
 |
Figure 1. Mean annual cycle of total ozone. |
 |
Figure 2. Annual cycle of the surface ozone concentration in the Alatau mountain. |
Curves of annual cycle are typical for the ozone behavior of middle
latitude of northern hemisphere.
Here is pronounced maximum of total ozone in winter (February),
when mean value of total ozone reach 390 D.U. Then it takes place
sharp decrease of total ozone to minimum. The minimum of total
ozone is gently sloping and illegible in summer (august). The
mean value of total ozone fluctuates from 280 D.U. to 300 D.U.
Annual cycle of the surface ozone concentration is defined by
maximum in spring-summer time (July) and minimum in autum-winter
time (November).
Previous: Introduction Next: Daily variations of total ozone and the surface ozone concentration Up: Ext. Abst