
1 Service dŪA»ronomie du CNRS Universit» Pierre et Marie Curie, Paris, France
2CEILAP (CITEFA-CONICET), Villa Martelli, Argentina
3Universidad de San MartŐn, San MartŐn, Argentina, apazmin@citefa.gov.ar
4Servicio MeteorolŘgico Nacional, Villa Ortôzar, Argentina
FIGURES
›
Abstract
During the last decades, special interest has been dedicated to the Antarctic ozone loss. Different stations were built to measure and develop their own statistical ozone database. In order to study the polar ozone decline, we present a statistical analysis of the ozone content over the Marambio Argentinean Antarctic station (64.2 S, 56.7 W) for the period 1997-1999. For this study, the position of the station with respect to the polar vortex is represented in a quasi-conservative space using the potential temperature and the equivalent latitude as an approximate vortex-following coordinate. This coordinate system frees the study from the dynamics of the polar vortex. The potential vorticity is computed from the ECMWF (European Center for Median Range Weather Forecasts) meteorological analyses. Besides, the inner and outer vortex borders are calculated from the potential vorticity second derivative as a function of equivalent latitude. Our study allows us to identify the polar vortex occurrences over Marambio and to determine whether the station is located inside, at the edge or outside the vortex, at different isentropic levels. The ground based ozonesondes measurements performed at Marambio as well as the TOMS data over the station are then studied as a function of potential temperature and equivalent latitude in order to evaluate the springtime ozone loss. The seasonal variation of ozone is analyzed and correlated with the position of the station with respect to the polar vortex over the 1997-1999 period.
Introduction
The ozone depletion has aroused the scientific over the last two decades. The concern about this issue is growing in the last years because of deeper Antarctic ozone losses and increasing vortex areas reaching populated regions in South America. In the Antarctic stratosphere a strong vortex forms in autumn, isolating the polar air from the surrounding mid-latitudes regions from April to the end of November. The low temperatures reached in this region allow the formation of polar stratospheric clouds (PSCs) and the initiation of heterogeneous chemical reactions inducing a rapid ozone decline in spring.
This paper is focused on the study of the Antarctic ozone depletion as observed at the Marambio station, located at 64.2 S, 56.7 W, in the period 1997-1999. The polar vortex position with respect to the Marambio station is studied in the equivalent latitude Ů potential temperature quasi-conservative space which can be assimilated to an approximate vortex-following coordinate [McIntyre, 1980]. In this way, our analysis is free from adiabatical vertical motions and from the frictionless motions of the vortex on isentropic surfaces. A statistical study of the vortex occurrences above the station is performed for different isentropic levels and according to the season. The position of Marambio in time is classified in inner, edge and outer situations. Thereafter, the total ozone seasonal variability is studied and correlated with the position of the station with respect to the polar vortex. The total ozone data are taken from TOMS and the 475 K isentropic level is used to determine the equivalent latitude of the station for total ozone measurements. The analysis of the ozone variability as a function of potential temperature is performed qualitatively because of the poorer statistics of the ozone profiles database at Marambio obtained from ground based ozonesondes measurements. In the last part of this work, a comparison of the ozone depletion observed at Ushuaia [Pazmi“o et al., 2000], the southern populated area from mid-latitudes (54.9 S, 68.3 W) and at the high latitude Marambio station.
Marambio in the Quasi-Conservative Coordinate System
We determine the position of the station as a function of potential temperature and equivalent latitude changing the 3D geographical coordinate system by the 2D quasi-conservative coordinate system. The equivalent latitude is a modified potential vorticity variable defined as the latitude enclosing the same area as the PV contour [McIntyre and Palmer, 1984]. Then the position of the vortex in equivalent latitude is determined. The vortex limit and the width of its edge are calculated in equivalent latitude using the approach of Nash et al. [1996]. In the new coordinates system, the pole corresponds to the position of maximum potential vorticity and coincides with the center of the vortex. We basically identify three regions: inner vortex, characterized by high PV values; outer vortex or Žsurf zoneŪ, by small PV values and the vortex edge, corresponding to the high PV gradient area. The vortex limit corresponds to the maximum gradient of PV weighted by the wind module, as a function of equivalent latitude. The inner and outer borders correspond to the local maximum and minimum of the second PV derivative. The position of Marambio and the vortex borders as a function of equivalent latitude and day at different isentropic level in 1997 is shown in fig. 1. The meteorological data used to compute the equivalent latitude and potential temperature are from the ECMWF (European Center for Median Range Weather Forecasts) analyses. Figure 1 shows that the polar vortex forms earlier in the middle stratosphere in autumn and propagates to the lower levels. The classification method is thus less efficient during this season because of the flatness of the PV fields, especially in the lower levels. The statistical study of the vortex occurrences above Marambio as a function of the isentropic level and season in 1997-1999 period is shown in fig. 2.

Figure 1. Temporal evolution of the Marambio position (dots) in equivalent latitude for autumn-spring period of 1997 at different isentropic levels. The solid lines correspond to the limits and boundaries of the vortex edge.

Figure 2. Percentage of inside (open circles), edge (pluses) and outside (dots) vortex situations of Marambio station as a function of season at different isentropic levels in the 1997-1999 period.
In autumn the outside vortex occurrences are predominant at low altitudes. The number of edge situations increases with altitude. The prevalence of vortex edge situations in 1997 and 1999, and inside situations in 1998 above 600 K is due to the greater vortex area in the middle stratosphere. This feature is most evident in 1998 with ~70% inside vortex occurrences. In winter, the station position alternate between inside and vortex edge situations in more than 40% of the cases at all levels. In 1998 up to ~80% inside vortex situations were encountered. In spring, the inner vortex situations are still predominant.
Ozone seasonal variability according to Marambio vortex position
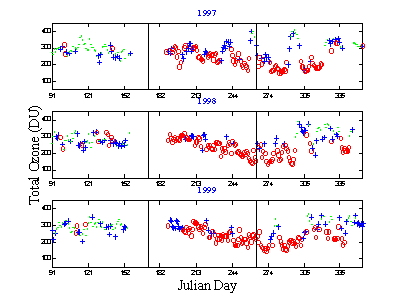
The equivalent latitude of Marambio is determined in the new coordinate system and compared to the vortex equivalent latitude at different isentropic levels. In this way, we can link the ozone variability over Marambio to inside, edge and outside situations. The method depends on the presence of the vortex in the stratosphere so the study is restricted to the autumn, winter and spring seasons. The total ozone column data used in this analysis are obtained from the TOMS measurements in the 1997-1999 time period. The ozone data are correlated with the Marambio equivalent latitude position at 475 K for the 1997-1999 period, (fig. 3).
›
Figure 3. Temporal ozone evolution over Marambio in the autumn-spring seasons in the 1997-1999 period, classified with the position of the station with respect to the polar vortex at 475 K. The inside, edge and outside vortex situations are represented by open circles, pluses, and dots respectively
In autumn, the ozone values increase slowly due to dynamical processes since the chemical processes are inactive during the polar night. This behavior is observed either inside, outside or in the vortex edge situations. In winter, the ozone values inside and in the edge of the vortex are predominant. These values continue to increase up to the start of the ozone destruction in July or in August. The poor sampling of the outer vortex situations in this season does not allow us to visualize the ozone behavior outside the vortex. In spring, we distinguish two different evolutions of the ozone amount between the inside and outside regions. This confirms the isolation of the polar vortex from the surroundings. Ozone values down to less than 150 DU are observed inside the vortex in the 1997-1999 period. At the end of spring, the total ozone amount starts to decrease outside the vortex as expected from the classical total ozone seasonal variation.
Figure 4 shows the ozone amount over Marambio as a function of the difference between the equivalent latitude of the station and the vortex limit, from August to November in the 1997-1999 period at 475 K. The ozone destruction occurs inside the vortex and also in the vortex edge, reaching the lowest values in mid-October. High values inside the vortex are obtained at the end of November as the vortex is disappearing and the classification of the data is not valid anymore. The increasing of outside vortex occurrences is consistent with the beginning of vortex destruction accompanied by the fill up of the ozone hole.
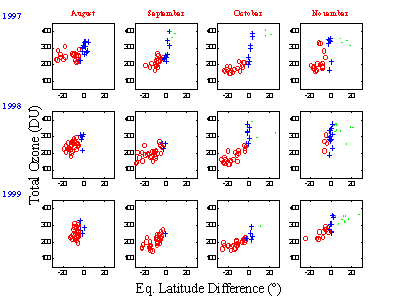
Figure 4. Total ozone content over Marambio as a function of the equivalent latitude difference with the vortex limit at 475 K from August to November in the 1997-1999 period.
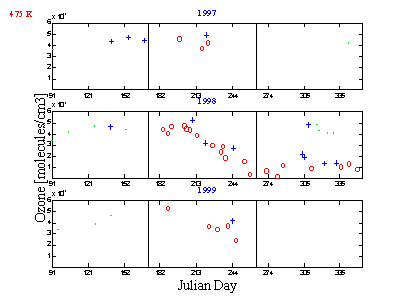
The vertical ozone distribution over Marambio is measured by ozonesonde measurements carried out at the station. The vertical extension of the measurements is from the ground to around 25 Km. Figure 5 shows two ozone vertical profiles as a function of potential temperature before and after the start of the ozone depletion. Figure 6 represents the temporal evolution of ozone over Marambio classified with respect to the position of the polar vortex in the 1997-1999 period at 400, 475, 550 and 800 K isentropic levels. No clear ozone evolution is seen in 1997 and 1999 because of the poor sampling at these different isentropic levels. In 1998, the higher amount of data allows us to distinguish inner and vortex edge situations above Marambio. This classification is limited to winter and spring seasons. In winter, the increase of the ozone at low isentropic levels (300-550 K) and the decrease above are due to dynamical processes (subsidence by infrared cooling) since the chemical processes are inactive during the polar night.

Figure 5. Comparison of ozone profiles obtained from the ozonesondes at Marambio station prior and during the ozone hole period in 1998.
 |
 |
 |
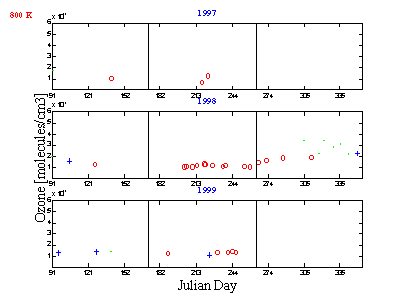 |
Figure 6. Temporal ozone evolution over Marambio in the 1997-1999 period, at 400, 475, 550 and 800 K isentropic levels. The inside, edge and outside the vortex are represented by open circles, pluses, and dots respectively.
In August, the beginning of the ozone destruction is observed in the low stratosphere. The lowest ozone amounts are found in the beginning of October. In November 1998, we can distinguish the low ozone amounts due to the destruction inside the vortex and the higher ozone amounts outside the vortex at 475 K.
Comparison between Ushuaia and Marambio situation
The position of the Marambio (64.2 S, 56.7 W) station in the new coordinate system is inside the vortex at the 475 K isentropic level, especially in the winter and spring seasons. In contrast, the position of the Ushuaia station (59.9 S, 68.3 W) is mostly outside the vortex, see Pazmi“o et al, 2000.
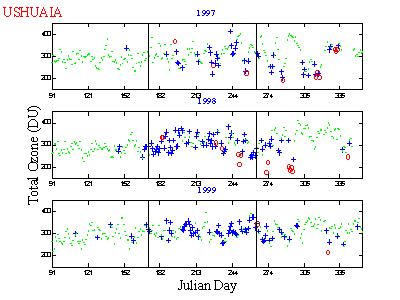
The ozone evolution over these stations is quite different, especially in 1997 and 1999: the ozone evolution over Ushuaia corresponds mostly to the mid-latitude behavior while the evolution over Marambio is of typical polar behavior. The temporal evolution of the total ozone over Ushuaia and Marambio classified with respect to the position of the polar vortex at 475 K is represented in figure 7 for the 1997-1999 period. In autumn, both stations show similar ozone evolution and the outside vortex situations are predominant. The values are around 290 DU for both stations. The ozone amounts increase slowly up to July.
 |
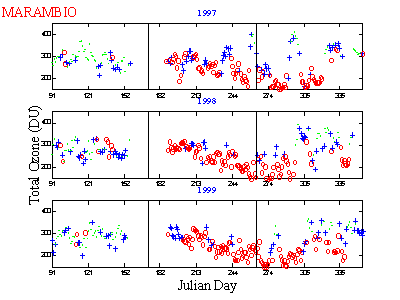 |
Figure 7. Temporal ozone evolution over Ushuaia and Marambio stations classified with respect to the position of the polar vortex at 475 K in the 1997-1999 period. The inside, edge and outside vortex situations are represented by open circles, pluses, and dots respectively.
In winter, the poorer sampling of the inner vortex and vortex edge situations at Ushuaia still allows us to observe the rapid ozone decline from August to mid-October, essentially in 1997 and 1998. In spring, the ozone values reach less than 150 DU over Marambio and 200 DU over Ushuaia in the September-October period.
Conclusions
The Marambio station is located in the Antarctic continent and the analysis of its position with respect to the polar vortex is necessary to correlate the Antarctic ozone depletion and the ozone behavior over this region. The new 2D coordinate system, equivalent latitude of the station at various isentropic levels, is used to classify the data with respect to the polar vortex. At 475 K in autumn, the station is outside the vortex in 40% of the cases and in the vortex edge in 30% of the cases. In the winter-spring seasons it is mostly inside the vortex. Ozone values less than 150 DU are detected in the beginning October. The study of the ozone evolution at different isentropic levels (fig. 6) shows the different ozone destruction rates in the low and middle stratosphere, especially in 1998. The comparison of the ozone evolution over Ushuaia and Marambio emphasize the different ozone behavior in the mid-latitude and polar regions.
Acknowledgments. Thanks are due to the ECMWF and TOMS data contributions. We also wish to thank the Servicio MeteorolŘgico Nacional of Argentina who provides the ozone vertical profiles performed by the ozonesondes at Marambio station. This work is supported by ANCYPT (Argentina).
References
McIntyre, M., Towards a Lagrangian-mean description of stratospheric circulation and chemical transports, Phil. Trans. R. Lond., 296, 129-148, 1980.
McIntyre, M., T. Palmer, The Žsurf zoneŪ in the stratosphere, J. Atmos. Terr. Phys., 46, 825-849, 1984.
Nash, E. R., P. A. Newman, J. E. Rosenfield, M. E. Schoeberl, An objective determination of the polar vortex using ErtelŪs potential vorticity, J. Geophys. Res., 101, 9471-9478, 1996.
Pazmi“o A. F., Godin S., Bekki S., Lavorato M. B., Quel E. J., M»gie G., Study of the influence of the Antarctic Ozone depletion over Ushuaia, Proceedings of the Quadrennial Ozone Symposium, 121-122, 2000
Back to
| Session 1 : Stratospheric Processes and their Role in Climate | Session 2 : Stratospheric Indicators of Climate Change |
| Session 3 : Modelling and Diagnosis of Stratospheric Effects on Climate | Session 4 : UV Observations and Modelling |
| AuthorData | |
| Home Page | |