Previous: Marambio in the Quasi-Conservative Coordinate System Next: Comparison between Ushuaia and Marambio situation Up: Ext. Abst.
Ozone seasonal variability according to Marambio vortex position
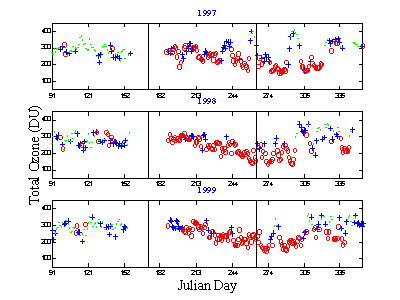
The equivalent latitude of Marambio is determined in the new coordinate system and compared to the vortex equivalent latitude at different isentropic levels. In this way, we can link the ozone variability over Marambio to inside, edge and outside situations. The method depends on the presence of the vortex in the stratosphere so the study is restricted to the autumn, winter and spring seasons. The total ozone column data used in this analysis are obtained from the TOMS measurements in the 1997-1999 time period. The ozone data are correlated with the Marambio equivalent latitude position at 475 K for the 1997-1999 period, (fig. 3).

Figure 3. Temporal ozone evolution over Marambio in the autumn-spring seasons in the 1997-1999 period, classified with the position of the station with respect to the polar vortex at 475 K. The inside, edge and outside vortex situations are represented by open circles, pluses, and dots respectively
In autumn, the ozone values increase slowly due to dynamical processes since the chemical processes are inactive during the polar night. This behavior is observed either inside, outside or in the vortex edge situations. In winter, the ozone values inside and in the edge of the vortex are predominant. These values continue to increase up to the start of the ozone destruction in July or in August. The poor sampling of the outer vortex situations in this season does not allow us to visualize the ozone behavior outside the vortex. In spring, we distinguish two different evolutions of the ozone amount between the inside and outside regions. This confirms the isolation of the polar vortex from the surroundings. Ozone values down to less than 150 DU are observed inside the vortex in the 1997-1999 period. At the end of spring, the total ozone amount starts to decrease outside the vortex as expected from the classical total ozone seasonal variation.
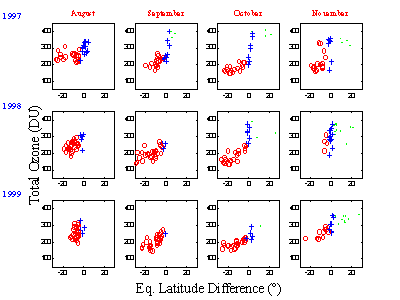
Figure 4 shows the ozone amount over Marambio as a function of the difference between the equivalent latitude of the station and the vortex limit, from August to November in the 1997-1999 period at 475 K. The ozone destruction occurs inside the vortex and also in the vortex edge, reaching the lowest values in mid-October. High values inside the vortex are obtained at the end of November as the vortex is disappearing and the classification of the data is not valid anymore. The increasing of outside vortex occurrences is consistent with the beginning of vortex destruction accompanied by the fill up of the ozone hole.

Figure 4. Total ozone content over Marambio as a function of the equivalent latitude difference with the vortex limit at 475 K from August to November in the 1997-1999 period.
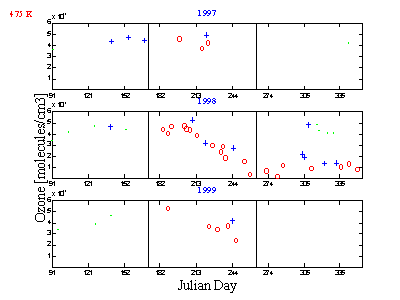
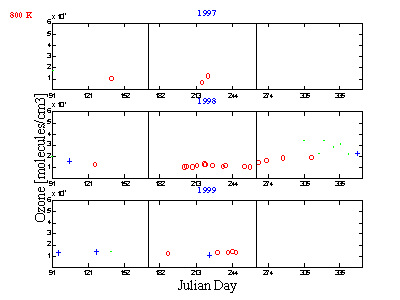
The vertical ozone distribution over Marambio is measured by ozonesonde measurements carried out at the station. The vertical extension of the measurements is from the ground to around 25 Km. Figure 5 shows two ozone vertical profiles as a function of potential temperature before and after the start of the ozone depletion. Figure 6 represents the temporal evolution of ozone over Marambio classified with respect to the position of the polar vortex in the 1997-1999 period at 400, 475, 550 and 800 K isentropic levels. No clear ozone evolution is seen in 1997 and 1999 because of the poor sampling at these different isentropic levels. In 1998, the higher amount of data allows us to distinguish inner and vortex edge situations above Marambio. This classification is limited to winter and spring seasons. In winter, the increase of the ozone at low isentropic levels (300-550 K) and the decrease above are due to dynamical processes (subsidence by infrared cooling) since the chemical processes are inactive during the polar night.

Figure 5. Comparison of ozone profiles obtained from the ozonesondes at Marambio station prior and during the ozone hole period in 1998.
 |
 |
 |
 |
Figure 6. Temporal ozone evolution over Marambio in the 1997-1999 period, at 400, 475, 550 and 800 K isentropic levels. The inside, edge and outside the vortex are represented by open circles, pluses, and dots respectively.
In August, the beginning of the ozone destruction is observed in the low stratosphere. The lowest ozone amounts are found in the beginning of October. In November 1998, we can distinguish the low ozone amounts due to the destruction inside the vortex and the higher ozone amounts outside the vortex at 475 K.
Previous: Marambio in the Quasi-Conservative Coordinate System Next: Comparison between Ushuaia and Marambio situation Up: Ext. Abst.