University of Wollongong, Dep of Chem, 2522 NSW, Australia; email: arndt@uow.edu.au.
FIGURES
Abstract
Introduction
In addition to the companion presentation P/2 3-13 on the seasonal cycles of conventional trace gases retrieved from ground-based FTIR spectra above Wollongong, Australia (34.45°S, 150.88°E), this contribution deepens the discussion into isotopic signals obtained from the same data set. (Due to the AGUs new copyright regulations we unfortunately could not include our conference presentation P/2 3-13, C.P. Rinsland, A. Meier, D.W.T. Griffith, and L.Chiou, "Ground-Based Measurements of Tropospheric CO, C2H6, and HCN from Australia at 34 degreesS latitude during 1997-1998," submitted to J. Geophys. Res., Dec 2000.) The retrieval of isotopic ratios from atmospheric FTIR spectra is an exciting new field.
Since 1996 high resolution ground-based infrared spectra have been recorded in solar absorption geometry at Wollongong, Australia (34.45°S, 150.88°E). Currently we operate the only NDSC (Network for the Detection of Stratospheric Change) FTIR spectrometer between 19.5°N and 45°S. We present a seasonal cycle of isotopic enrichments in stratospheric ozone, a case study on altitude resolved water vapour isotopic ratios, and first results from an isotopic study in nitrous oxide. An assessment of the current uncertainties of this new technique shows that our main limitation is given by the limited accuracy of the spectroscopic data base currently used (HITRAN96). This prevented us in particular from showing any results we obtained for CH4 and HCl originally announced for this conference.
Data analysis
The data analysis is described in detail in Meier (1997) and Meier et al. (1996 and 1998). Details of the Wollongong site and the preparation of auxiliary data such as meteorological data is given in Griffith et al (1998) and in our companion presentation P/2 3-13. Briefly, the analysis software used thus far for all but the latest results is SFIT-1 version 1.09e (e.g. Rinsland et al., 1988) (yields total column amounts only). Profile retrievals that yield volume mixing ratio profiles were performed with the new SFIT2 vers. 3.74 algorithm (Connor et al., 1998 and 1995, Rinsland et al, 2000) for the analysis of N2O and a re-analysis of the Wollongong water vapour data. The meteorological data is based on local radio sonde profiles splined into NMC data above ceiling altitude. The forward model and ray-tracing was performed with the improved fscatm code version 2.02 as of Aug 2000. All other scripting and auxiliary programs are taken from the SFIT-Tools suite (http://www.uow.edu.au/~arndt/sftools.htm).
Stratospheric ozone
Large isotopic anomalies have been reported for ozone in the past, with a pro nounced maximum in the stratosphere, but the obser vations are spatially and temporally limited (Mauersberger, 1981; Meier and Notholt, 1996; Irion et al 1996b). Although the experimental evi dence is very consistent, we are still short of a satisfac tory theoretical understanding (Krankowski & Mauersberger, 1996). Our inability to ex plain the observed isotopic composi tion im plies that we do not fully understand the ozone forma tion process. Current chemi cal models are known to show significant biases compared to observations when integrating the net ozone deple tion over a full winter period at high latitudes (Goutail, 1998), which coincides with par ticularly strong anomalies in the isotopic composition of ozone (Meier et al., 1998).
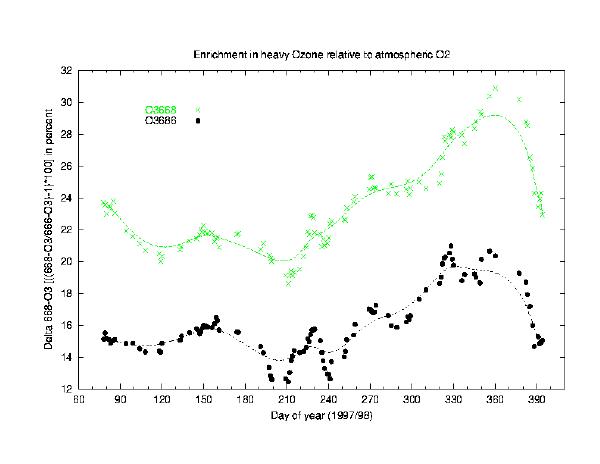
The very high enrichments observed (Fig.1) are consistent both with balloon borne in-situ measurements based on mass-spectrometric analysis (Mauersberger, 1981) and with FTIR observations both from ground at high latitudes (Meier et al, 1996 & 1998) and from space (Irion et al, 1996b). Recent laboratory studies (Mauersberger, priv.comm, 1999) have identified individual formation pathways of ozone that carry an enrichment of up to 50 %(!) while others show no enrichments at all. Although we have confidence that the enrichment in ozone is caused in its formation rather than in its numerous destruction processes, our theortical understaning remains fairly incomplete. Given that each sunlit ozone molecule in the middle stratosphere is photolysed and recycled every 30 min on average, small uncertainties in the formation process may have significant effects on the equlibrium concentration of total ozone.
Figure 1: This figure illustrates the isotopic enrichment of heavy ozone relative to atmospheric molecular oxygen in delta-notation. Studied are the two most abundant heavy isotopomers of ozone; i.e. 16O16O18O and 16O18O16O (O3-668, O3-686). Please note that both heavy species are of same mass (50) that cannot be destinguished by classical mass-spectrometry. The seasonal cycle shwon is the first reported for isotopical ozone. A maximum is found in the early Australian summer with a 30 % higher enrichment than found during winter. Both isotopomers are highly correlated though offset against each other. The precison of individual measuremnts are 2% in terms of enrichment and the solid line represents a spline fit to the daily mean values shown.
Water vapour
Water vapour is both the most important greenhouse gas, accounting for 60 % of the total radiative heating, and a key factor for stratospheric ozone depletion through its role of condensing into ice clouds which boosts heterogeneous chemistry (Kirk-Davidoff, 1999). This contrasts with our poor understanding of water in the atmosphere which adds the greatest uncertainty to present cli mate models. To date it is unclear how much of the observed increase in stratospheric water vapour is a consequence of enhanced methane oxidation and how much results from enhanced vertical transport of humid air (Forster, 1999). Water vapour from each of these two major sources has a significantly different iso topic composi tion (Irion, 1996a). Simultaneous measurement of water vapour VMRs and their isotopic composition may enable us to resolve the current ambiguity regarding the sources of stratospheric water vapour increases and to quantify the exchange of water vapour across the topopause. Our observations may also provide valuable input to recent models that include isotopic information on water vapour (Hoffman et al, 1998).
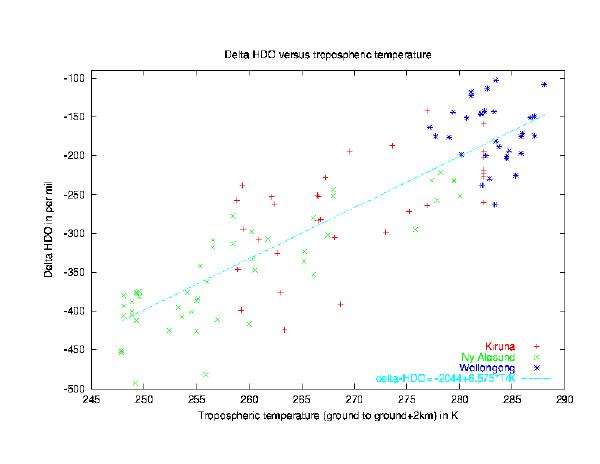
A clear correlation of the delta-D values with the ambient temperature is found that is consistent for three sites studied. As expected theoretically, heavy isotopes are removed preferentially by condensation and subsequent precipitation due to the differences in the lower ground state energies and vapour pressures. Cold and dry air masses are thus stronger depleted in Deuterium. Unlike the case of ozone, water vapour isotopic fractionation is fully understood by classical mass-dependent fractionation processes that occur with every phase transition. The first comprehensive description given by Daansgard (1953) is still valid today and explains all aspects in a quantitatively correct way.
|
|
|
Figure 2: This figure shows the depletion in Deuterium in tropospheric
water vapour relative to Standard Mean Ocean Water (SMOW) as a
function of the mean ambient temperature from ground to ground+2km.
About 90 % of all water vapour molecules are located in the lowermost
2 km making this temperature a good approximation for our observations.
The depletion is expressed in the ?-notation with ?D defined as
?D =(([D/H]sample/[D/H]reference)-1)·1000
The measurements reported are taken from 3 sites: Wollongong (35°S), Kiruna (68°N) and Ny-Alesund (79°N). The symbols represent individual measurements unbiased in
seasons.
Although the VMR profiles both of normal H2O and HDO that we obtained (poster figure not included here) look quite reasonable, the delta-D values raise questions about their trustworthyness. It is noted that the water vapour VMR profiles of normal H216O drop more rapidly in the 2 to 5 km region than suggested by VMRs calculated from radio sonde relative humidity data. The underestimation of H in the 2 to 4 km region results in much too high D/H ratios and the resulting delta-D values are completely unreasonable between 2 and 4 km. The spectroscopic data of water vapour in HITRAN96 (in particular the pressure broadening coefficients which determine the altitdue distribution retrieved) are known to be of limited quality. Bob Toth has recently remeasured large regions in the infrared consistently for H2O and HDO, though unfortunately the lines used in the present study were not included (yet). However, the improvements in the regions covered thus far are most encouraging and we are confident that both the use of alternative lines in those regions and the ongoing work by Toth and co-workers will allow us to overcome these problems in the near future. Please note, that the isotopic ratios calculated for the total column amounts are little affected by this problem and that results reported for FTIR total columns are in good agreement with theoretical expectations and in-situ measurements.
Nitrous oxide
N2O is both an important greenhouse gas and is involved in stratospheric ozone destruction. Source rates at the surface are small relative to its total abundance and its major sink is photolysis in the stratosphere. The currently large uncertainties in accounting for indivdual sources can be additionally constrained by isotopic maesurements. The main sink of N2O is photolysis in the stratosphere with a marked asymmetry between different isotopomers of N2O (Yung and Miller, 1997).
Recent analysis of balloon borne FTIR observations by one of us
(Griffith et al., 2000) show a strong enrichment for stratospheric
14N15N16O quantitatively consistent with the ground-based data we present
here and with laboratory spectroscopy (Turatti et al., 2000).
To our knowledge the observations reported here are the first
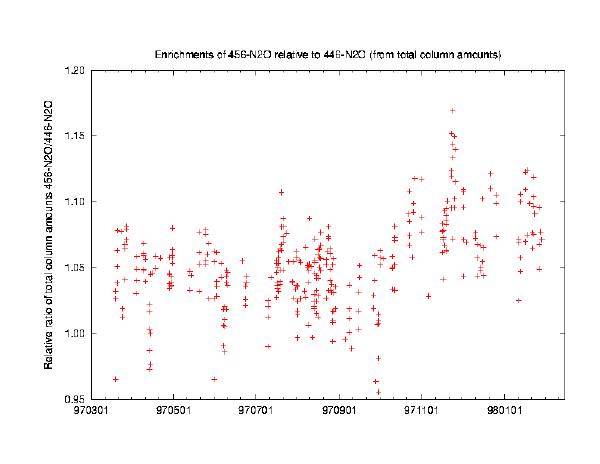
attempt made by remote sensing from ground. N2O is still work in progress. Currently we can only show a scatter
plot of total columns of 14N15N16O versus 14N14N16O from indivdual observations. The line parameters used are the
most recent ones published by Toth et al (2000 and references
therein). However, we are confident to present shortly altitude
resolved data and to provide two more isotopomers.
|
| |
Figure 3: This scatter plot illustrates the enrichment of 14N15N16O to the bulk species 14N14N16O (456/446 N2O) relative to the isotopic enrichment assumed in the R.Toth spectroscopic data (Toth, 2000). At this stage our data is to be seen as a feasability study. Not all potential sources of systematic error have been fully adressed. However, we are confident that the enrichment shown for 14N15N16O is in any case significant, though there is still some uncertainty on the absolute scale. We have also identified suitable absortption lines to quantify 15N14N16O and 14N14N18O, but no time was left to prepare that data adequately for this conference. Please note also that we used profiling in our analysis and aim to present altitude resolved isotopic data.
References
Connor, B.J., N.B. Jones, S.W. Wood, J.G. Keys, C.P. Rinsland, and F.J. Murcray, "Retrieval of HCl and HNO3 profiles from ground-based FTIR data using SFIT2", Proceedings of the 18th Quadr. Ozone Symp., L'Aquila, Italy, edited by R.D. Bojkov and G.Visconti, pp 445-488, Parco Scientifico e Technologico d'Abruzzio, L'Aquila, 1998.
Dansgaard, W., "The abundance of 18O in atmospheric water and water vapour", Tellus, 5, 461-470, 1953.
Dinelli,B., et al., "Measurement of the isotopic ratio distribution of HDOand H2 16Oin the 20 - 38 kmaltitude range from far-infrared spectra", Geophys. Res. Let., 24, 2003-2006, 1997.
Forster, P. M. de F. and K.P. Shine, "Stratospheric water vapour changes as possible contributor to observed stratospheric cooling", Geophys. Res. Let., 26, 3309 - 3312, Nov 1999.
Goutail, F. et al, "Total ozone reduction in the arctic vortex during the winters of 1995/96 and 1996/97", air pollution report 66 of the EU, EUR 18032, ISBN 92-828-2365-2, 277 - 280, 1998.
Griffith, D., G.C. Toon, B. Sen, J-F. Blavier, and R.A. Toth, "Vertical profiles of nitrous oxide isotopomer fractionation measured in the stratosphere", Geophys.Res.Let, 27, 2485-2488, 2000.
Griffith, D.W.T., N.B. Jones, and W.A. Matthews, "Interhemispheric ratio and annual cycle of carbonyl sulfide (OCS) total column from ground
based solar FTIR spectra", J. Geophys. Res., 103 (D7), 8447-8454, 1998.
Irion, F.W., et al., "Stratospheric observations of CH3D and HDO from ATMOS infrared solar spectra: Enrichments of deuterium in CH4 and implications for HD", Geophys. Res. Let., 23, 2381-2384, 1996a.
Irion, F.W., et al., "Heavy ozone enrichment from ATMOS infrared solar spectra", Geophys. Res. Let., 23, 2377 - 2380,1996b.
Hoffmann, G., M. Werner, and M. Heimann, "Water isotope module of the ECHAM atmos pheric general circulation model: A study on timescales from days to several years", J. Geophys. Res., 103, 16871-16896, 1998.
Kirk-Davidoff,D.B., E.J. Hintsa, J.G. Anderson, D.W. Keith, "The effect of climate change on ozone depletion through changes in stratospheric water vapour", Nature, 402, 399 - 401, 1999.
Krankowsky, D. & K. Mauersberger, "Heavy ozone - a difficult puzzle to solve", Science, 274, 1996.
Mauersberger, K., "Measurement of Heavy Ozone in the Atmosphere", GRL, 8, 935--937, 1981.
Meier, A., T. Blumenstock, and H. Nakajima, "Regular isotopic observation of stratospheric ozone and its implications for the ozone formation theory", air pollution report 66 of the EU "Polar Stratospheric Ozone", EUR 18032, ISBN 92-828-2365-2, p.216 - 219, 1998.
Meier, A., "Determination of atmospheric trace gas amounts and corresponding natural isotopic ratios by means of ground-based FTIR
spectroscopy in the high arctic", Reports on Polar Research, Vol. 236, 311 p., ISSN 0176-5027, Bremerhaven, 1997.
Meier, A. and J. Notholt, "Determination of the isotopic abundances of heavy ozone as observed in arctic ground-based FTIR-spectra", Geophys. Res. Lett., 23, 551-554, 1996.
Rinsland, C.P., A. Goldman, B.J. Connor, T.M. Stepen, N.B. Jones, S.W. Wood, F.J. Murcray, S.J. David, R.D. Blatherwick, R. Zander, E. Mahieu, and P. Demoulin, "Correlation relationships of stratospheric molecular constituents from high spectral resolution, ground-based infrared absorption spectra", J. Geophys. Res., 105, 14637 - 14652, 2000.
Rinsland, C.P., A. Goldman, F.J. Murcray, F.H. Murcray, R.D. Blatherwick, and D.G. Murcray, "Infrared measurements of atmospheric trace gases above Mauna Loa, Hawaii, In Feb 1987", J. Geophys. Res., 93, 12607 - 12626, 1988.
Rothman, L.S., et al., "The HITRAN molecular spectroscopic database and HAWKS (HITRAN atmospheric workstation)", 1996 edition, J. Quant. Spectrosc. Radiat. Transfer, 60, 665 - 710, 1998.
Toth, R.A., Line strengths (900-3600 cm-1), self-broadened linewidths, and frequency shifts (1800-2360 cm-1) of N2O, Applied Optics, 32 (36), 7326-7365, 1993.
Toth, R.A., N2 - and air broadened-linewidths and frequency-shifts of N2O, J. Quant. Spectrosc. Radiat. Transfer, 66, 285-304, 2000.
Back to
| Session 1 : Stratospheric Processes and their Role in Climate | Session 2 : Stratospheric Indicators of Climate Change |
| Session 3 : Modelling and Diagnosis of Stratospheric Effects on Climate | Session 4 : UV Observations and Modelling |
| AuthorData | |
| Home Page | |