Previous: Improvement of the geometric features determination Next: Conclusion Up: Ext. Abst.
4. Results and discussion
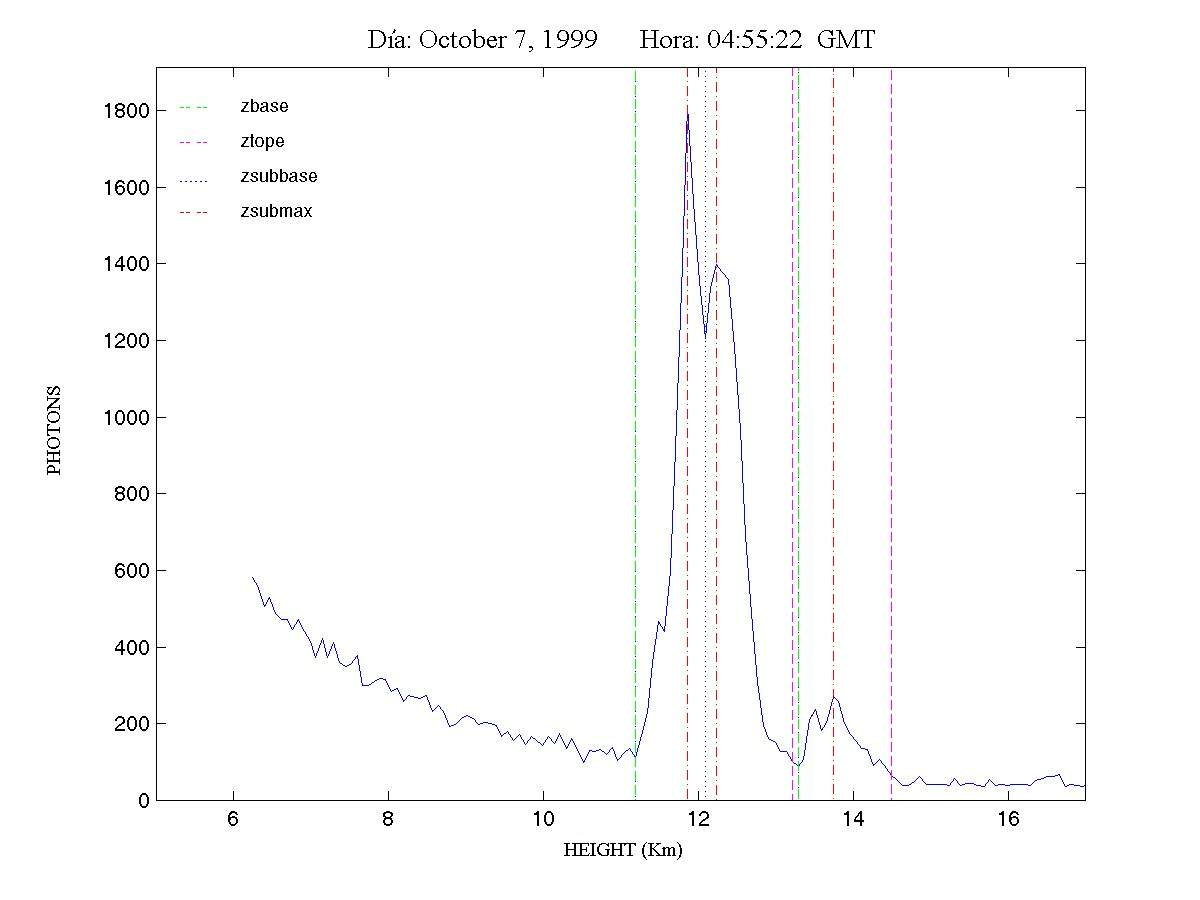
The present algorithms improves the determination of the geometric features of cirrus clouds. The example of graphical result of the algorithm apply to one day is show in the figure 2. We can vew in the figure the geometrical characteristics of cirrus clouds such as base and top height.
Figure 2 Example of graphical result of algorithm to one day of measurement
On figure 3 the regression between the former and the new method for the top of the first detected cirrus layer and the base height is shown. The correlation coefficient for the top height of the first layer of cirrus is 0.47, it is very low because of incorrect determination in the manual method. In the other hand, the correlation coefficient for the base height is 0.95 . It meaning that there was not a big improvement on the determination of the base height.
Figure 3 missing
Figure 3. Regression Curves between the former and new method for the top of the first detected cirrus layer(first) and for the base height (second).
The statistical analysis of cirrus clouds measured at CLS between 1992 and 1996 is shown in the next table. The total of cases analyzed was 169, with 134 in the rainy periods (May - October) and 35 in the low rainy (November - April).
Table 2. Some statistical parameters for geometrical characteristics of cirrus clouds, measurements at Camagüey with lidar.
|
|
|
|
|
|||||
|
|
|
|
|
|
|
|||
| Mean (Km) |
10.61
|
14.06
|
11.12
|
13.59
|
|
|
||
| Standard Deviation |
1.60
|
1.53
|
1.26
|
1.18
|
|
|
||
| Minimum (Km) |
7.66
|
10.51
|
7.96
|
11.71
|
|
|
||
| Maximum (Km) |
14.56
|
17.86
|
12.54
|
15.16
|
|
|
||
Further analysis of the results show similar results regarded the presence of cirrus clouds in the vicinity of tropical tropopause.
Previous: Improvement of the geometric features determination Next: Conclusion Up: Ext. Abst.