Camagüey Lidar Station, Centro Meteorológico, PO Box 134, Camagüey
70100, CUBA
Phone: (53) 322-61103, e-mail: bbarja@met.cmw.inf.cu
FIGURES
Abstract
The study of the cirrus clouds is of special interest for the scientific community, because it have been recognized they have a great influence on weather and climate trough their effect on the radiative energy budget in the Earth ? Atmosphere system. The behavior of tropical cirrus and the relationship whit the dehydration process in the vicinity of the tropical tropopause have not still been very well understood. This paper presents the new method development in the Camagüey Lidar Station (CLS) for the determination of the cirrus clouds geometrical properties. We explain the behavior of geometrical properties of cirrus clouds (transparent or semitransparent) measured with radar laser (Lidar) in the Meteorological Center of Camagüey (21.40º N, 77.92º E) during the period of 1993 ? 1999. The results show in general for the Cloud Base and Cloud Top average, the values of 10.71 and 13.97 km respectively. While for the rainy period these variables have the values of 10.61 and 14.06 km and for the dry period 11.12 and 13.59 km.
1. Introduction
The cirrus clouds play an important role in the climate system, and it is influence in the radiation budget of the earth (Sassen, 1992). And, recently, the contribution by the cirrus clouds to the concentration of water vapor in the Upper Troposphere, is presently under depth scrutiny. The scientific community is trying to understand its role in the hydrologic cycle of the planet (WCRP, 1998). In this propose the measurement of lidar is very fundamental technique as complementation of the geometrical and microphysical characteristics of cirrus clouds determination with other techniques such as satellite, sunphotometers, spectrometers, etc.
There are only few lidars in the tropical zone, one of the less studied regions of the planet but at the same time a very important piece in our effort to understand the climate system. One of those lidars is located in the Camagüey Lidar Station (CLS) at the Meteorological Center (CMC), Cuba, (21 24´ N, 77 51´ W).
In this paper we report the new method developed in the CLS and the most behavior of it in comparison with past manual algorithm. Also, the geometrical properties of cirrus clouds (subvisibles) measured with lidar in nighttime during the period of 1993 - 1999 is show.
2. Main features of the instrumental and data processing
The lidar was installed in 1988, as part of the Cuban-Soviet cooperation in tropical meteorology research, but only began regular operation in January 1992. Measurements were carried out on cloud free nights. Table 1 shows its main parameters.
Table 1. Lidar technical parameters.
|
|
|
|
|
|
|
|
|
|
|
|
|
|
|
|
|
|
|
|
|
Some times, under apparently clear sky conditions the initial set of shots, used to check the functioning of the lidar, reveals the presence of cirrus clouds. In those cases, these sets of shots have been saved. Beginning in 1993, these are done with resolution of 75 m, and beginning processing in the year 1995, with the manual algorithm..
3. Improvement of the geometric features determination
Initially, the geometrical feature of cirrus clouds measured with lidar at CLS, were determined using a manual algorithm (Estevan et al., 1998). As in any manual method, the human factor played a role, contributing to the uncertainties of measurement process. Recently, it has been developed in an software for making such processing with standard criteria and eliminating the subjectivity of the former one.
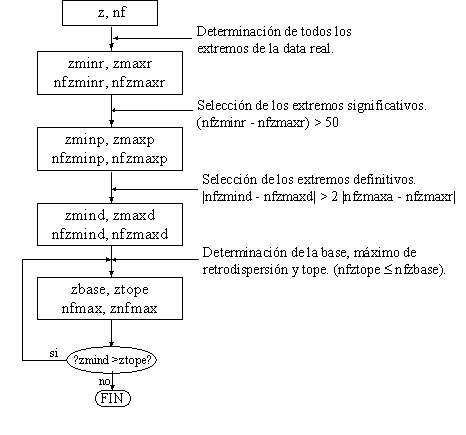
The new processing algorithm based in the determination of minimum and maximum, using differential method analysis of the number of photons signal. Begins with the elimination of the noise in the number of photons vs. Altitude curve, using moving average . Then series minimum & maximum are determined, and only the pairs of consecutive minimum & maximum with differences higher than 50 photons are selected as probable cirrus geometric base and retrodispersion maximum. The criteria of the minimum difference of 50 photons was determined from manual analysis of the dataset.
The further analysis take in consideration that the difference in the original profile between the probable minimum and maximum is at least twice the difference between the number of photons at the maximum's altitude in the original dataset and the one filtered. After this point the minimum value which comply with the former criteria are selected as base height of the cirrus clouds.
Then we process to determine the top height In the original data we found the altitude above the minimum, which determined as base height, which number of photons is equal or less than the number of photons in the altitude of the base. This is the so called "apparent top", defined by (Pal et al., 1992).
This procedure is repeated for all the minimum & maximum selected that are higher than top height, figure 1 shows the flowchart of the algorithm.
Figure 1. Flowchart of the algorithms
4. Results and discussion
The present algorithms improves the determination of the geometric features of cirrus clouds. The example of graphical result of the algorithm apply to one day is show in the figure 2. We can vew in the figure the geometrical characteristics of cirrus clouds such as base and top height.
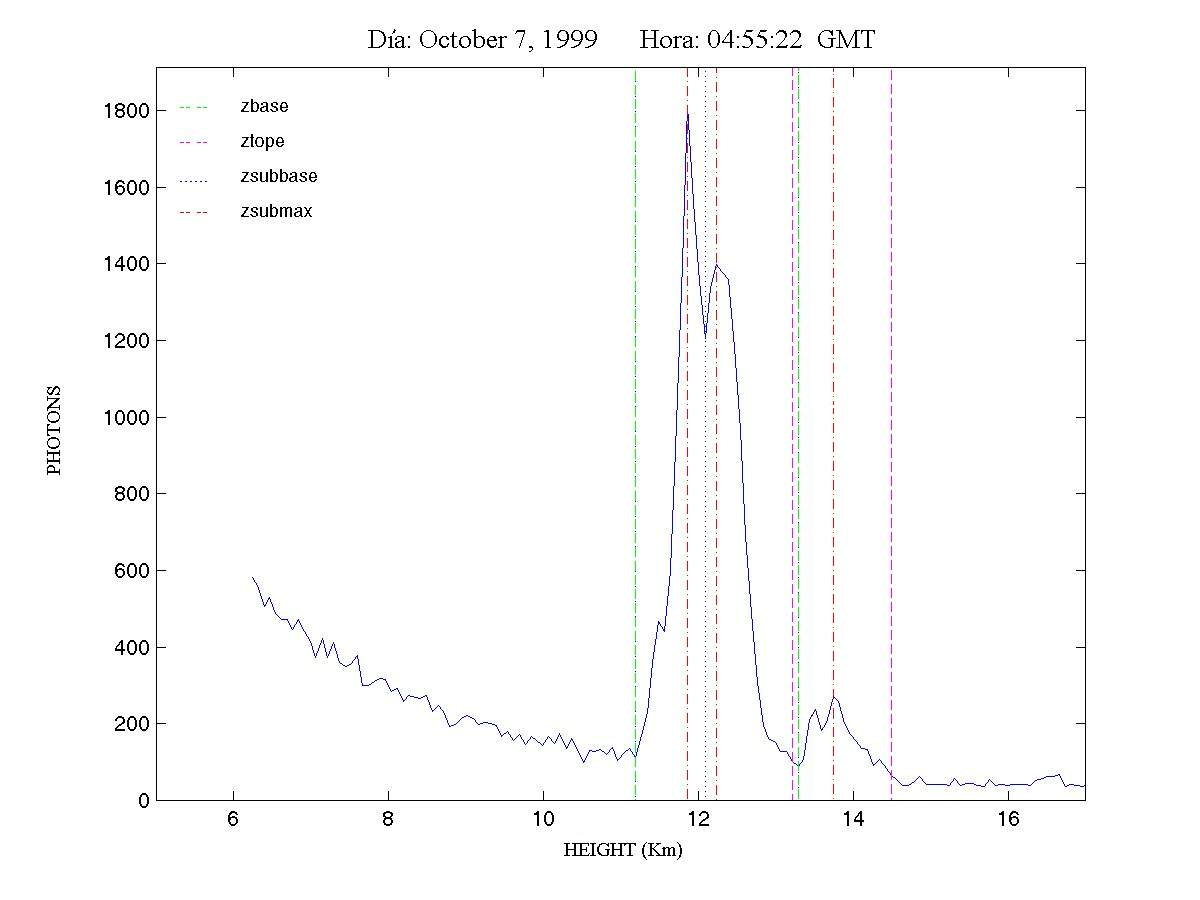
Figure 2 Example of graphical result of algorithm to one day of measurement
On figure 3 the regression between the former and the new method for the top of the first detected cirrus layer and the base height is shown. The correlation coefficient for the top height of the first layer of cirrus is 0.47, it is very low because of incorrect determination in the manual method. In the other hand, the correlation coefficient for the base height is 0.95 . It meaning that there was not a big improvement on the determination of the base height.
Figure 3 missing
Figure 3. Regression Curves between the former and new method for the top of the first detected cirrus layer(first) and for the base height (second).
The statistical analysis of cirrus clouds measured at CLS between 1992 and 1996 is shown in the next table. The total of cases analyzed was 169, with 134 in the rainy periods (May - October) and 35 in the low rainy (November - April).
Table 2. Some statistical parameters for geometrical characteristics of cirrus clouds, measurements at Camagüey with lidar.
|
|
|
|
|
|||||
|
|
|
|
|
|
|
|||
| Mean (Km) |
10.61
|
14.06
|
11.12
|
13.59
|
|
|
||
| Standard Deviation |
1.60
|
1.53
|
1.26
|
1.18
|
|
|
||
| Minimum (Km) |
7.66
|
10.51
|
7.96
|
11.71
|
|
|
||
| Maximum (Km) |
14.56
|
17.86
|
12.54
|
15.16
|
|
|
||
Further analysis of the results show similar results regarded the presence of cirrus clouds in the vicinity of tropical tropopause.
5. Conclusion
A computerized processed method for determination geometrical features of cirrus had been developments it improves the original manual method used at CLS. It improved is clear in the determination of the top of the few layers. Almost not differences were found in the case of the base height. A new, improved, statistics of cirrus geometrical features in Camagüey, Cuba, has been produced.
6. Ongoing work
At CLS we are developing a quantitative method for determining cirrus backscattering and optical depth. Such method will be in future research.
7. References
Ansmann, A., J. Bosenberg, G. Brogniez, S. Elouragini, P. H. Flamant, K. Klapheck, H. Linn, L. Menenger, W. Michaelis, M. Riebesel, C. Senff, P-Y. Thro, U. Wadinger and C. Weitkamp, 1993: Lidar network observations of cirrus clouds morphological and scattering properties during the International Cirrus Experiment 1989: The 18 October 1989 case study and statistical analysis. J. Appl. Meteorol., 32, 1608 ? 1622.
Antuña J. C., R. Aroche, A. Guaty y C. Morales (1994) Comportamiento de la tropopausa en el PMC. Parte I: Variables aerológicas. Ciencias de la Tierra y el Espacio # 23-24.
Cervantes S. y R. Aroche (1997). Análisis de las Nubes Cirros Medidas por la Estación Lidar en Camagüey, Cuba, durante el Período de Marzo 1992 hasta Agosto de 1996. Reporte Científico Técnico. (Manuscript, unpublished). 19 pp.
Estevan, R., R. Aroche, I. Pomares and S. Cervantes, 1998: Aerosols, cirrus clouds and temperature measurements with lidar in Camagüey, Cuba. Proceeding of 19th ILRC.
Imasu R. and Y. Iwasaka (1991). Characteristics of Cirrus Clouds Observed by Laser Radar (Lidar) during the Spring of 1987 and the Winter of 1987/88. Journal of the Meteorological Society of Japan., 69, No. 3, pp. 401-411.
Mims, F., (1996). Bulletin of the Global Vulcanism Network. Vol. 21, No. 2, pp.13.
Pal, S.R., W. Steinbrecht, and A. I. Carswell, (1992). Automated method for lidar determination of cloud base height and vertical extend. Appl. Optics. 31 - 10, 1488 - 1494.
Sassen, K. (1992). Evidence of liquid-phase cirrus cloud formation from volcanic aerosols: climate implications. Science,257,pp.516-519.
Song, N., D. o’Starr, D. Wuebbles, A. Williams and S. larson (1996). Volcanisc aerosols and interanual variation of high clouds. Geophys. Res. Let., 23, pp. 2657-2660.
WRCP, 1998: Stratospheric indicators of climate change, Chapter 2 in "SPARC implementation Plan", WRCP report No. 105.
Back to
| Session 1 : Stratospheric Processes and their Role in Climate | Session 2 : Stratospheric Indicators of Climate Change |
| Session 3 : Modelling and Diagnosis of Stratospheric Effects on Climate | Session 4 : UV Observations and Modelling |
| AuthorData | |
| Home Page | |