 .
.
Here, the averages are temporal averages taken along each particle's path. This quantity should be near 1 for a particle that goes straight up, -1 for a particle that goes straight down, and 0 for particles with oscillatory or no vertical motion. The magnitude of a particle's displacement over the time period of the trajectory integration can be determined by calculating
 .
.
Finally, if we also calculate the average cloud condensate (liquid
water plus ice) along a particle's path  , we can establish the following criteria for convective updraft
motions:
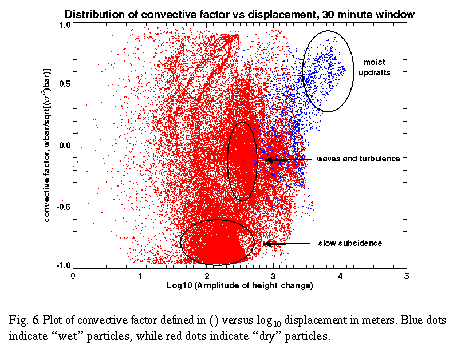
Particles were released at 1 km intervals in the horizontal and 0.25 km intervals in the vertical in the lower 15 km of the domain, starting at 7200 seconds. The particles were released for 30 minutes, to obtain an optimal amount of separation between updraft and non-updraft particles. A scatter plot of the convective factor versus displacement is shown in Fig 6. Physical interpretations can be made of several of the regions in the plot. The trajectories with the highest displacements also move up on average, and are cloudy as well, indicating that these particles can be associated with moist convective updrafts. The many particles that have displacements of 50 - 500 m and a convective factor near -1 are affected by the slow subsidence outside of the storm. The particles with significant displacements and a convective factor near zero are undergoing wave or turbulent motions, oscillating about their initial position.

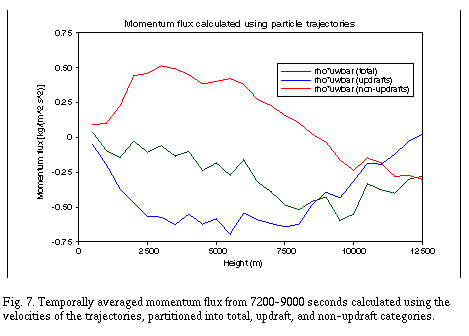
In this trajectory analysis, 1229 particles qualified as updraft
particles, but these particles had a major contribution to the
momentum flux of the troposphere, as shown below in Fig. 7.Here,
the momentum flux  is calculated at each 120 second output time within the 7200-9000
second interval using velocity perturbations from the horizontal
means.

