[1] Universidad de Tarapacá , Facultad de Ciencias, Departamento
de F'isica, Casilla 7-D, Arica, Chile.
[2] Laboratory for Atmospheres, Goddart Space Flight Center, NASA,
Greenbelt, MD 20770, Maryland, U.S.A.
[3] Raytheon ITSS, NASA Goddard Space Flight Center, Greenbelt,
Maryland, U.S.A.
[4] Biospheric Sciences Branch, NASA, Goddard Space Flight Center,
Greenbelt, Maryland, U.S.A.
FIGURES
ABSTRACT
In this work, we present the first results of measurements of UV- multi-component aerosols made by an automatic CIMEL Sunphotomer installed by NASA in Agreement with University of Tarapacá Arica? Chile. We analyze spectral measurement of t from 340-1020 nm obtained from a ground based Aerosol Robotic Network radiometers AERONET, which is located in Arica (Lat.:18° 29´S, Long.: 70° 19´ W, 25m). Desert dust aerosols are present, at this location due to the proximity of the Atacama desert (the world´s driest), and fine mode aerosols are also present. Aerosol size distribution retrieval analysis are also presented. The data show that in some days there is curvature in the ln t vs ln l plot, which is related to the dominance of the accumulation mode aerosols. In this case a second order polynomial fit to the ln t vs ln l provided in Arica provides a good agreement with the measurements. Satellite TOMS estimates of optical depth for this region were also obtained.
1. Introduction
Accurate knowledge of the spatial and temporal aerosol concentrations are important due to their influence on climate change. During several years satellite aerosol measurements were made and the global distribution of UV-absorbing aerosols were obtained from TOMS satellite measurements. The measurements show several major sources or aerosols types: biomass burning, desert dust, and urban/industrial. The importance of satellite aerosol measurements is that presence of aerosol in the atmosphere affects the radiation balance and the amount of UV flux reaching the ground. These factors have special importance in zones of the earth that have large flux of UV radiation. One of these zones is the North of Chile, this is coastal desert zone near to the equator which also has a large increase of the altitude to the east. This increase in altitude greatly increases the amount UV flux that reach the ground. Detection of UV-absorbing aerosols and calculation of optical depth by satellite measurements are affected by the presence of large scale and sub-pixel clouds in the TOMS field of view. Nimbus 7/TOMS (Heath et al., 1975) measured the amount of backscattered UV radiance in six 1 nm wide wavelength bands (313, 318, 331, 340, 360, and 380 nm) 14.5 years, from November 1978 to March 1993 [Herman et al., 1996]. This satellite study revealed that desert dust is a major aerosol type in areal extent over land and oceans. Aerosols are injected in to the atmosphere and cover areas far outside of their source region, from advection of UV-absorbing particulate. The TOMS measurements of absorbing UV aerosols was made using a modified form of the spectral contrast method, the residue method, that explained in detail in [Herman et al., 1997]. In the north of Chile a large source of UV-absorbing aerosols in the atmosphere is desert dust. In the case where the dust particles are very small it could reside in the atmosphere by several days. For example in [Herman et al., 1997] is possible observe that in October 1998, UV absorbing aerosol occurrences lasting more than 5 days. Several years of TOMS measurements conclude that atmospheric UV-absorbing aerosols have an important source in desert zones, such as the case of the Atacama desert in the North of Chile. A remote sensing aerosol monitoring network (AERONET) [Holben et al., 1998] initiated by NASA and consisting of weather resistant automatic sun and sky scanning spectral radiometers enables frequent measurements of atmospheric aerosol optical properties. The CIMEL automatic sunphotometer made direct sun measurements at 340, 380, 440, 500, 675, 870, 940, and 1020 nm. These solar extinction measurements are used to compute aerosol optical depth at each wavelength. Retrieval total precipitable water in cm is obtained to 940 nm channel. The sky radiance almuncantar measurements at 440, 675, 870 and 1020 nm, in conjunction with direct sun measured at these same wavelengths. In the variability and size of atmospheric aerosols in desert zones near the ocean, are influenced by the processes that initially form than, in this case for example oceanic wave action producing sea salt aerosol [Hoppel et al., 1990], and airborne soil particles [D¨Almeida, 1987]. Dynamic processes such as aging and hygroscope growth are of importance in the size distribution of aerosols. Radiative properties of aerosols are strongly influenced by the aerosol size distribution [Eck et al., 1999]. Several factors influenced by the size distribution, some of more relevant are: scattering phase function, single scattering albedo and spectral variation of aerosol optical thickness.
2. Aerosol Optical Thickness
The variation in size distribution affect the spectral dependence of aerosol optical thickness, which is very important for modeling the radiative effects of aerosols in the atmosphere. In this work the aerosols optical thickness and its spectral dependence are related with Angstrom wavelength parameter a . Angstrom´s empirical expression is given as
![]() (1)
(1)
where l is the wavelenth in microns and b is Angstrom´s turbidity coefficient.
Taking the logarithm the Angstrom wavelength exponent [Eck et al., 1999] may be computed from spectral values of t .
![]() (2)
(2)
and a is the negative of the slope t vs l in the logarithmic scale.
3. Data Analysis
We present measurements of spectral t a from 340-1020 nm to multicomponent aerosols in Arica.
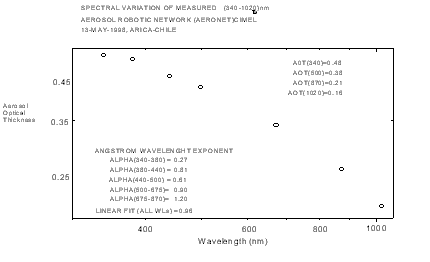
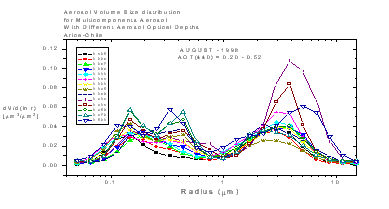
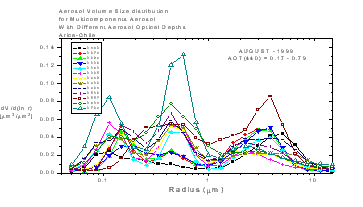
Figure 1 show wavelength dependence t for Arica which CIMEL measurements made 13-May-1998, the t values varies to 0.16 at 1022 nm to 0.48 at 339 nm. The data shows a curvature of t vs l , on the logarithm scale. Second order polynomial providing an excellent fit to data, the difference between the measured t and the values from the second order fit were 0.008 or less. The linear fit is also show in figure 1, large departures from the measured data is observed in this case. The figures 2,3 show the aerosol volume size distribution in Arica to August 1998-1999, the measurements reveals that the magnitude of the accumulation mode peak increasing with increasing t , the modal peak radius also increase in size for AOT(440)=0.195-0.404, and decrease to AOT(440)=0.431-0.520. We observe the presence of multicomponent aerosols in accumulation sized particles. If we consider only a mean value in volume size distribution value we observe the presence of a second dominant aerosol mode of accumulation sized particles. The source of this second accumulation mode particles in Arica is uncertain, but may be the result of industrial fish activities in this zone and by the effects to transport and manipulation to mines products in the sea port, near to the CIMEL location.

Figure 1. Spectral variation of measured t (340-1020 nm) from an Aerosol Robotic Network (AERONET) CIMEL, radiometer for multicomponent aerosols in Arica, Chile. The linear fit and the second order polynomial fit of ln t vs ln l are also shown.
In figures 4(a,b,c), we compare aerosol volume size distribution for multicomponents aerosols with different aerosol optical depth. In Figure (4a) we observe the behavior of aerosol volume size distribution mode and desert dust aerosols [Eck et al., 1999]. In three pictures observe two aerosols modes a coarse particle mode having a computed effective radius of 300 nm, and a second aerosol mode of accumulation-sized particles, the accumulation mode peak radius decrease 0.2 m m to 0.15 m m in August 1999, this type of aerosols is related with urban aerosols, for example fuels utilized in urban activity and environmental conditions of temperature, humidity, solar radiation intensity near of the ocean, and cloud cover.

![]()
Figure 2. Aerosol volume size distribution for multicomponent aerosols in Arica-Chile, August 1998 with different aerosols optical depths. The retrievals were derived from simultaneous analysis of sky radiance in the almucantar and spectral t at 440, 675,870 and 1020 nm.

Figure 3. Aerosol volume size distribution for multicomponent aerosols in Arica-Chile, August 1999 with different aerosols optical depths. The retrievals were derived from simultaneous analysis of sky radiance in the almucantar and spectral t at 440, 675,870 and 1020 nm.
 |
 |
 |
Figure 4. Comparison of Aerosol volume size distribution for multicomponent aerosols in Arica-Chile, August 1998-1999 with AOT(440) for three different retrievals. (a) AOT(440)=0.267, (b) AOT(440)=0.286, (c) AOT(440)=0.311 The retrievals were derived from simultaneous analysis of sky radiance in the almucantar and spectral t at 440, 475,870 and 1020 nm.
Conclusions
In this work show the presence of multicomponent aerosols in accumulation sized particles. If we consider only a mean value in volume size distribution value we observe the presence of a second dominant aerosol mode of accumulation sized particles. The source of this second accumulation mode particles in Arica is uncertain, but may be the result of industrial fish activities in this zone and by the effects to transport and manipulation to mines products in the sea port, near to the CIMEL location Two aerosols modes a coarse particle mode having a computed effective radius of 300 nm, and a second aerosol mode of accumulation-sized particles, the accumulation mode peak radius decrease 0.2 m m to 0.15 m m in August 1999, this type of aerosols is related with urban aerosols, for example fuels utilized in urban activity and environmental conditions of temperature, humidity, solar radiation intensity near of the ocean, and cloud cover
Acknowledgement
The support of this Research is by University of Tarapacá Research and Postgrade Office (DIPOG) under Project 4722/99 and is gratefully acknowledged the support of USRA Goddard Visiting Scientist Program, and NASA/GSFC Research Program, Code 916 and Code 923.
References
D´Almeida, G. A., On the variability of desert aerosol radiative characteristics, J. Geophys. Res.,92, 3017-3026, 1987.
Eck, T. F., B. N. Holben, J. S. Reid, O. Dubovik, A. Smirnov, N. T. O´Neill, I. Slutsker, and S.Kinne, Wavelength dependence of the optical depth of biomass burning, urban, and desert dust aerosols, J. Geophys. Res., 104, 31,333-31,349, 1999.
Heath, D. F., A. J. Krueger, H. R. Roeder, and B. D. Henderson, The solar backscatter ultraviolet and total ozone mapping spectrometers (SBUV/TOMS) for Nimbus G, Opt. Eng., 14, 323-331, 1975.
Herman, J. R., P. K. Bhartia, J. Ziemke, Z. Ahmad, and D. Larko, UV-B increases (1979-1992) from decreases on total ozone, Geophys. Rev. Lett., 23, 2117-2120, 1996.
Herman, J. R., P. K. Bhartia, O. Torres, N. C. Hsu, C. J. Seftor, and E. Celarier, Global distribution of UV-absorbing aerosols, J. Geophys. Res., 102, 16,911-16,922, 1997.
Holben, B. N., et al., AERONET- A federated instrument network and data achieve for aerosol characterization, Remote Sens., 12, 1147-1163, 1991.
Hoppel, W. A., J. W. Fitzgerald, G. M. Frick, R. E. Larson, and E. J. Mack, Aerosol size distributions and optical properties found in the marine boundary layer over the Atlantic Ocean, J. Geophys. Res., 95, 3659-3686, 1990.
Back to
| Session 1 : Stratospheric Processes and their Role in Climate | Session 2 : Stratospheric Indicators of Climate Change |
| Session 3 : Modelling and Diagnosis of Stratospheric Effects on Climate | Session 4 : UV Observations and Modelling |
| AuthorData | |
| Home Page | |