Previous: Aerosol Optical Thickness Next: Conclusions Up: Ext. Abst.
3. Data Analysis
We present measurements of spectral t a from 340-1020 nm to multicomponent aerosols in Arica.
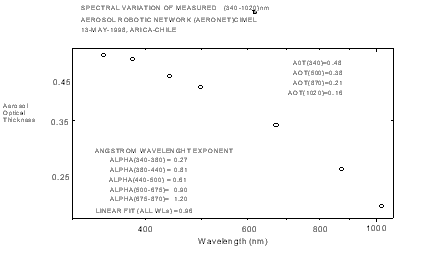
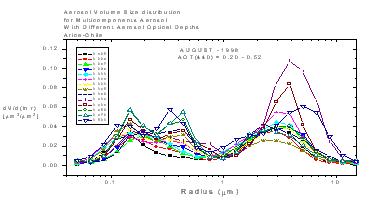
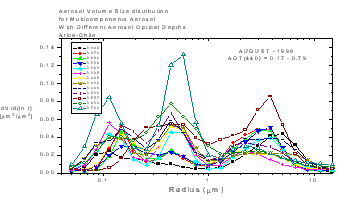
Figure 1 show wavelength dependence t for Arica which CIMEL measurements made 13-May-1998, the t values varies to 0.16 at 1022 nm to 0.48 at 339 nm. The data shows a curvature of t vs l , on the logarithm scale. Second order polynomial providing an excellent fit to data, the difference between the measured t and the values from the second order fit were 0.008 or less. The linear fit is also show in figure 1, large departures from the measured data is observed in this case. The figures 2,3 show the aerosol volume size distribution in Arica to August 1998-1999, the measurements reveals that the magnitude of the accumulation mode peak increasing with increasing t , the modal peak radius also increase in size for AOT(440)=0.195-0.404, and decrease to AOT(440)=0.431-0.520. We observe the presence of multicomponent aerosols in accumulation sized particles. If we consider only a mean value in volume size distribution value we observe the presence of a second dominant aerosol mode of accumulation sized particles. The source of this second accumulation mode particles in Arica is uncertain, but may be the result of industrial fish activities in this zone and by the effects to transport and manipulation to mines products in the sea port, near to the CIMEL location.

Figure 1. Spectral variation of measured t (340-1020 nm) from an Aerosol Robotic Network (AERONET) CIMEL, radiometer for multicomponent aerosols in Arica, Chile. The linear fit and the second order polynomial fit of ln t vs ln l are also shown.
In figures 4(a,b,c), we compare aerosol volume size distribution for multicomponents aerosols with different aerosol optical depth. In Figure (4a) we observe the behavior of aerosol volume size distribution mode and desert dust aerosols [Eck et al., 1999]. In three pictures observe two aerosols modes a coarse particle mode having a computed effective radius of 300 nm, and a second aerosol mode of accumulation-sized particles, the accumulation mode peak radius decrease 0.2 m m to 0.15 m m in August 1999, this type of aerosols is related with urban aerosols, for example fuels utilized in urban activity and environmental conditions of temperature, humidity, solar radiation intensity near of the ocean, and cloud cover.

![]()
Figure 2. Aerosol volume size distribution for multicomponent aerosols in Arica-Chile, August 1998 with different aerosols optical depths. The retrievals were derived from simultaneous analysis of sky radiance in the almucantar and spectral t at 440, 675,870 and 1020 nm.

Figure 3. Aerosol volume size distribution for multicomponent aerosols in Arica-Chile, August 1999 with different aerosols optical depths. The retrievals were derived from simultaneous analysis of sky radiance in the almucantar and spectral t at 440, 675,870 and 1020 nm.
 |
 |
 |
Figure 4. Comparison of Aerosol volume size distribution for multicomponent aerosols in Arica-Chile, August 1998-1999 with AOT(440) for three different retrievals. (a) AOT(440)=0.267, (b) AOT(440)=0.286, (c) AOT(440)=0.311 The retrievals were derived from simultaneous analysis of sky radiance in the almucantar and spectral t at 440, 475,870 and 1020 nm.