This code is based on dynamic diagnostic tools developed by Nakamura [Nakamura et al., 1996] running on PV maps from ECMWF. In this concept, the two dimensional PV mixing is diagnosed using A, the area between PV contour and a reference contour, presently corresponding to equator line. For dynamic diagnostic, two tools using an area coordinate are useful to define and identify barriers:
 the PV gradient in area coordinate . This gradient is expected
display a local maximum at the barrier location.
the PV gradient in area coordinate . This gradient is expected
display a local maximum at the barrier location.
- L2=

where
L is the equivalent length of the PV contour and determines the mixing effectiveness due to erratic movements. This equivalent length is expected to display a minimum at the barrier position.By combining these two criteria, it is possible to determine PV values corresponding to barriers and to infer barriers location by reversing to Cartesian coordinates.
This method enables to make a quasi-automatic detection of dynamic barriers on instantaneous PV maps.
2) PV advection code (MIMOSA):
We use the high resolution contour advection code (MIMOSA) developed
at the Service d'Aéronomie, CNRS, by A. Hauchecorne [Hauchecorne
,1998]. This code is based on PVdata calculated from 1.125x1.125°
ECMWF fields. From these fields, PV is advected on twelve hours
and regrided on the initial grid to reduce advection divergence.
3) Ozone measurements at Reunion island station:
Pressure, temperature, humidity and ozone radiosoundings have
been launched routinely at Reunion island since 1992, with a bi-mensual
rate until the beginning of 1999 and every week from that date.
ECC cells with a 0.5% cathode solution are used for ozone measurements.
More than two hundred profiles have been recorded and a monthly
climatology of ozone from this Reunion data set is available.
Anomaly detection on individual profiles are set against this
climatology in the present study.
A stratospheric ozone DIAL Lidar has been installed at Reunion
island, since May 2000. This Lidar, presented on Fig. 1, has been
built by Geneva University and its scientific management is done
together by the Service d'Aeronomie, CNRS, and the Laboratoire
de Physique de l'Atmosphere, Reunion University. Ozone vertical
profiles are obtained between 18 and 40 km altitudes.
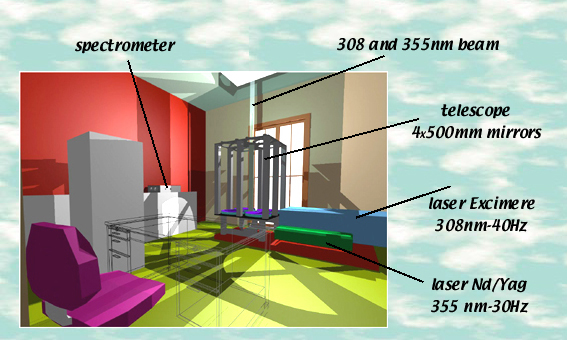
Figure 1: schematic representation of the Reunion stratospheric ozone DIAL Lidar
3) A case study of isentropic exchange above Reunion Island:
The radiosounding ozone profile versus potential temperature,
obtained the 12th July 2000, at Reunion island, is presented on figure 2. It is
compared with the monthly climatologic ozone profile of July.
The 12th July, ozone concentration shows an abnormal behaviour above 500K
by comparison with the climatologic evolution. This anomaly is
important and significative between 550K and 750K. It can be noted
that it is positive below 625K and negative above. It can reach
15 to 20% around 680K.
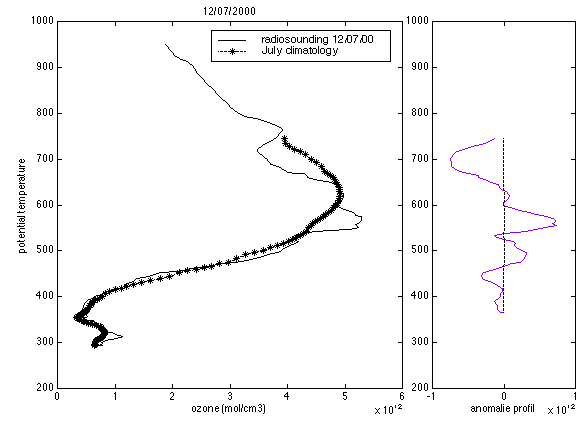
Figure 2: comparison of the 12-07-2000 ozone radiosounding profile with the July climatologic profile.
In order to confirm this observation on the radiosoundings ozone
profile, we have also a Lidar sounding for the 12th of July night, that is to say 12 hours after the radiosounding.
The Lidar profile displays fluctuations very closed to the radiosounding
ones, as we can see on Fig 3. The differences, less than 8% above
20 km, can be explained by the fact that the two measurements
were not simultaneous and that the two instruments have different
vertical resolutions. Yet, the anomaly observed on radiosounding
is clearly apparent on Lidar measurement, between 24 and 28 km.
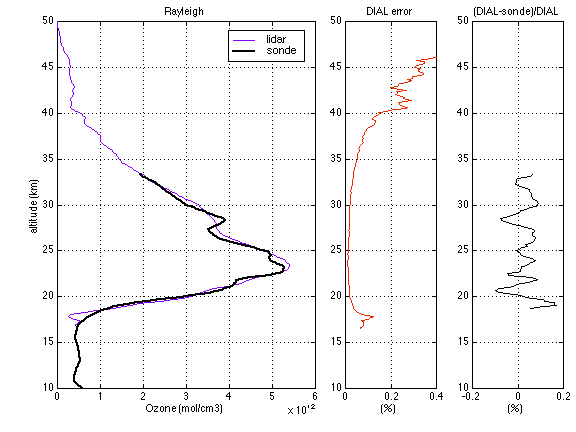
Figure 3: Comparison between Lidar and radiosoundings profiles obtained the 12th of July, at Reunion island (left box). Statistic error on DIAL profile (medium box). Relative error between the two measurements (Right box)."
In order to understand the origin of this anomaly on the ozone
profile, it is interesting to consider the potential vorticity
behaviour above Reunion Island for the month of July 2000. All
the potential vorticity data shown in this study have been calculated
from ECMWF dynamic fields. Its evolution above Reunion Island
during July 2000 at 600K is presented on Fig. 4. The average of
this parameter correponding to whole austral winter 2000, and
2s upper and lower limits are also presented (dotted line) in
this Figure. It is to be noted that vorticity above Reunion Island,
displays an important anomaly, significative at 2s on 12th of July 2000. This anomaly is positive and corresponds to the
arrival of very high PV air masses in this zone.
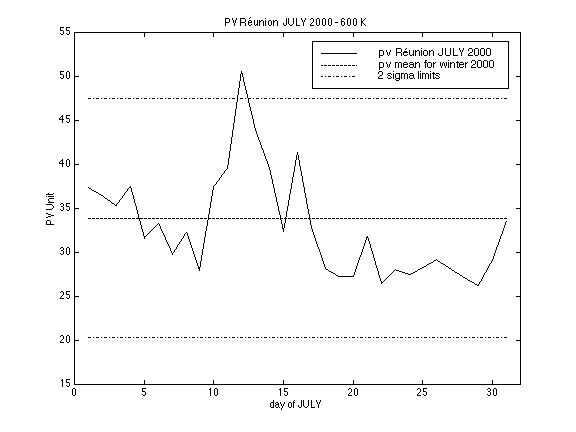
Figure 4: PV evolution at 600 K above Reunion island during July 2000 compared with average PV value on all winter 2000.
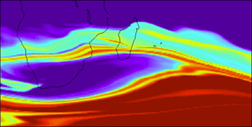
The results computations by LOBADY code of dynamic barriers location, for dates around 12th July 2000 at 600K altitude, are presented on Fig. 5. It is to be noticed that Reunion island (West from Madagascar) is rather under the influence of equatorial air masses before the 10th July. The subtropical dynamic barrier is around Reunion Island on the 10th July. From the 11th July, the stratosphere above this site is under the influence of midlatitudes air masses . It is noteworthy that although Reunion is under the influence of midlatitudes from the 11th July, the major influence on PV (Fig. 4) is actually taking place since the 12th.
It can clearly be observed, on Fig. 5, that the subtropical barrier
is initially present around 25°S on average. It loses its shape
from the 10th of July above South Africa, creating a low PV large tongue that
stretches, the following days, towards the south of Indian Ocean
area. This way down of low PV to the south is going simultaneously
together with , on its front, a way up of midlatitudes air to
the north. It is this high PV back tongue that influences Reunion
island from the 12th of July.
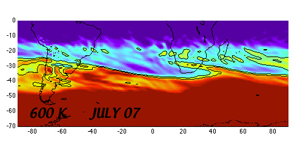
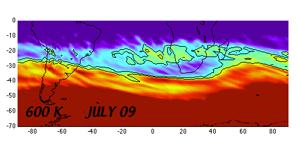
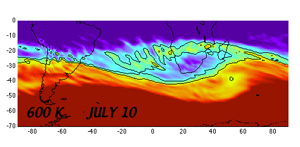
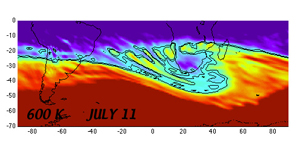
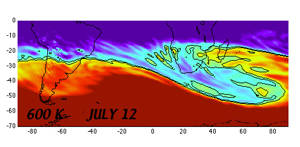
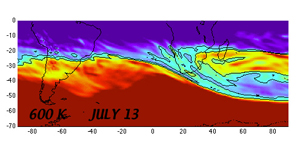
Figure 5: south subtropical dynamic barrier location, around 12th July 2000, calculated with LOBADY code.
In order to confirm these observations, we have computed with MIMOSA code high resolution PV contour advections. The PV fields advected for dates around the 12th of July are presented on Fig. 6. The much better resolution of contour advection method enables to more occuratly observe the filament coming above Reunion. By zooming in the southwestern part of the Indian Ocean, we can more clearly observe the arrival of a high PV air mass on the 12th, above Reunion island, coming from midlatitudes. This model shows again the formation of a low PV air filament around the 9th of July in the southern part of African continent. This filament stretches to the south-east and is phased with the way up of midlatitudes air masses to Reunion island.
Model outputs, for the following days, show that Reunion island
stays under the influence of this high PV core only until the
15th of July. The low PV tongue further stretching, after this date,
to the south-east. It will be completely mixed in the surf zone
around the 22th of July.
09/07/2000 10/07/2000
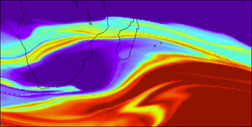
11/07/2000 12/07/2000
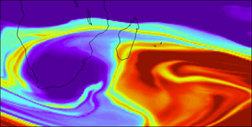
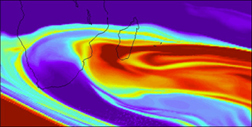
13/07/2000 14/07/2000
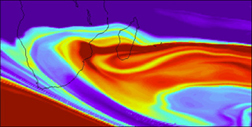
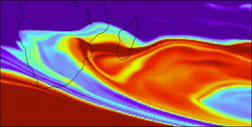
Figure 6: Map of advected PV around Reunion Island at 600 K, calculated with MIMOSA high resolution transport model.
The zonal wind at 800K, for this period (data not shown), shows the formation of a very important westerly core on the south of Madagascar, around 35°S. Its evolution is directly correlated to the filament development described above. This core is born around the 10th, reaches its maximum on the 12th and moves, the following days, to the east. This suggest that this westerly core could be at the origin of the filamentation. This agrees with the fact that planetary waves can enter from below in the stratosphere only when winds are from the west. A strong transport out of the tropics occurs when there are westerlies in midlatitudes [Waugh et al., 1996].
In order to further understand the signatures observed on ozone profiles, we have compared annual ozone profiles obtained from HALOE instrument on board of UARS platform. Three characteristic climatologic profiles have been calculated: the first one corresponds to Reunion island latitude, the second to latitudes close to 10°S and the third to midlatitudes around 40°S. They are presented on Fig. 7.
Assuming that ozone is conservative during a transport of relatively
short time scale, the Fig. 7 suggests that the arrival at Reunion
island of air masses coming from midlatitudes should implicate
a positive signature on ozone, if the transport is occurring at
an altitude inferior to about 625K, and a negative anomaly if
the transport is taking place above.
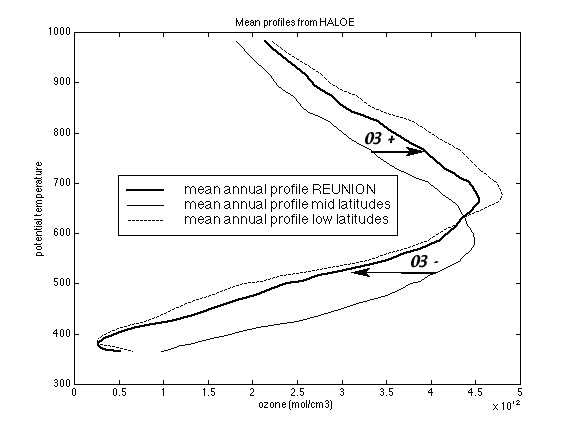
Figure 7: comparison of annual climatologic ozone profiles corresponding to equatorial latitudes (10°S), midlatitudes (40°S), and Reunion island latitude. These profiles are obtained from HALOE measurements.
This last inference is in complete agreement with the anomalies
observed on 12th July ozone profiles. An increase of concentration is observed
below 625K and a decrease above.
Conclusion:
DIAL Lidar observations and the radiosounding observations on stratospheric ozone obtained at Reunion island offer the opportunity to analyse a case study of quasi-horizontal stratospheric transport, between 550K and 700K, around the 12th July 2000. This transport has been diagnosed from the dynamic barrier detection LOBADY code and the high resolution PV advection MIMOSA code. It appears that the air masses that interest Reunion island from the 12th of July, and that induce a high PV increase, come from midlatitudes. This isentropic way up is consecutive to the formation of an air filament coming from equatorial latitudes, characterised by low PV, stretched to the south east and isentropically mixed in the midlatitudes surf zone. This transport from midlatitudes are perfectly according with the anomalies observed on Reunion island ozone profiles on the 12th of July.
The installation of a stratospheric DIAL lidar at Reunion Island,
and the implementation of performant diagnostic tools for dynamic
analysis, enable today to think of making more complete studies
on stratospheric transport in this tropical region. Such studies
should document the transport through the subtropical stratospheric
barrier and the long term ozone evolution.
Acknowledgement : I would like to thank all the LPA radiosoundings team, the technical and scientific LIDAR team from Service d'Aéronomie of CNRS. I would like to thank particularly Jean-Luc Baray for helpful comments and suggestions. HALOE data are issued from NASA Langley Research Centre.
References :
Dunkerton, T.J., and D. O’Sullivan, " Mixing zone in the tropical stratosphere above 10 mb", Geophys. Res. Let., 23, 18, 2497-2500, 1996.
Hauchecorne, A., "A high resolution advection model for interpretation of ozone filaments observed in lower stratosphere ozone lidar profiles at midlatitudes", Proc. of Mesoscale Processes in the lower stratosphere, Bad Toelz, Germany, 1998.
Grant, W.B., E.V. Browell, C.S. Long, L.L. Stowe, R.G. Grainger, and A. Lambert, "Use of volcanic aerosols to study the tropical stratospheric reservoir", J. Geophys. Res., 101, 3973-3988, 1996.
Holton, J.R., P.H. Haynes, M.E. McIntyre, A.R. Douglass, R.B. Rood, and L. Pfister, "Stratosphere-troposphere exchange." Rev. Geophys., 33, 403-439, 1995.
Nakamura, N., "Two-dimensional mixing, edge formation, and permeability diagnosed in an area coordinate", J. Atmosph. Sciences, 53, 11, 1524-1537, 1996.
Randel, W.J., F. Wu, J.M. Russel, A. Roche, J.W. Waters, "Seasonal cycles and QBO variations in stratospheric CH4 and H2O observed in UARS HALOE data", J. Atmosph. Sci. , 55, 163-185, 1998.
Schoeberl, M.R., A.E. Roche, , J.M. Russell III, D. Ortland, P.B. Hays and J. W. Waters, "An estimation of dynamical isolation of the tropical lower stratosphere using UARS wind and trace gas observations of the quasi-biennal oscillation", Geophys. Res. Let., 24, 1, 53-56, 1997.
Waugh, D.W., "Transport of material out of the stratospheric Arctic vortex by Rossby wave breaking", ", J. Geophys. Res., 99, 1071-1088, 1994a.
Waugh, D.W., R.A. Plumb, P.A. Newman, M.R. Shoerberl, et al., "Fine scale poleward transport of tropical air during AASE 2", J. Geophys. Res., 99, 1071-1088, 1994b.
Waugh, D.W., "Seasonal variation of isentropic transport out of the tropical stratosphere", J. Geophys. Res., 101, D2, 4007-4023, 1996.