This code is based on dynamic diagnostic tools developed by Nakamura [Nakamura et al., 1996] running on PV maps from ECMWF. In this concept, the two dimensional PV mixing is diagnosed using A, the area between PV contour and a reference contour, presently corresponding to equator line. For dynamic diagnostic, two tools using an area coordinate are useful to define and identify barriers:
 the PV gradient in area coordinate . This gradient is expected
display a local maximum at the barrier location.
the PV gradient in area coordinate . This gradient is expected
display a local maximum at the barrier location.
- L2=

where
L is the equivalent length of the PV contour and determines the mixing effectiveness due to erratic movements. This equivalent length is expected to display a minimum at the barrier position.By combining these two criteria, it is possible to determine PV values corresponding to barriers and to infer barriers location by reversing to Cartesian coordinates.
This method enables to make a quasi-automatic detection of dynamic barriers on instantaneous PV maps.
2) PV advection code (MIMOSA):
We use the high resolution contour advection code (MIMOSA) developed
at the Service d'Aéronomie, CNRS, by A. Hauchecorne [Hauchecorne
,1998]. This code is based on PVdata calculated from 1.125x1.125°
ECMWF fields. From these fields, PV is advected on twelve hours
and regrided on the initial grid to reduce advection divergence.
3) Ozone measurements at Reunion island station:
Pressure, temperature, humidity and ozone radiosoundings have
been launched routinely at Reunion island since 1992, with a bi-mensual
rate until the beginning of 1999 and every week from that date.
ECC cells with a 0.5% cathode solution are used for ozone measurements.
More than two hundred profiles have been recorded and a monthly
climatology of ozone from this Reunion data set is available.
Anomaly detection on individual profiles are set against this
climatology in the present study.
A stratospheric ozone DIAL Lidar has been installed at Reunion
island, since May 2000. This Lidar, presented on Fig. 1, has been
built by Geneva University and its scientific management is done
together by the Service d'Aeronomie, CNRS, and the Laboratoire
de Physique de l'Atmosphere, Reunion University. Ozone vertical
profiles are obtained between 18 and 40 km altitudes.
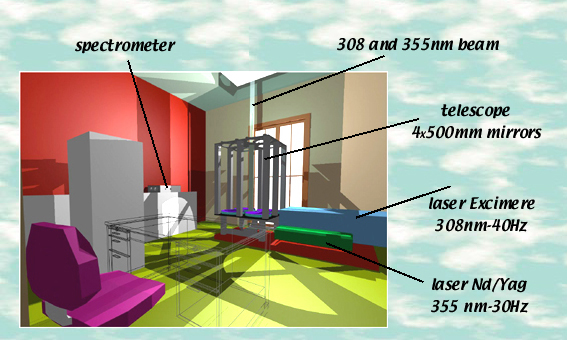
Figure 1: schematic representation of the Reunion stratospheric ozone DIAL Lidar