Previous: Multiple Comparisons at one Local Next:Conclusions Up: Ext. Abst.
One on One Comparisons
During the time period of these intercomparisons, differences normalized to remove the annual cycle, should remain constant. When they do not is another indication of a calibration shift in the instrument.

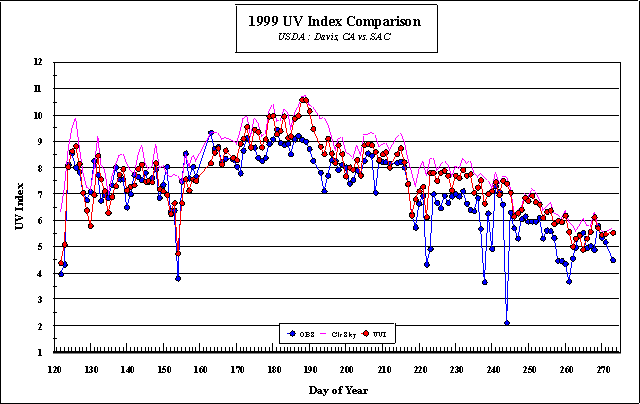
Figure 8 shows the observations and UV Index forecasts for Davis,
CA. Davis characteristically has very clear skies throughout the May to
August time period.
Visual inspections of the time series suggests a change in the differences
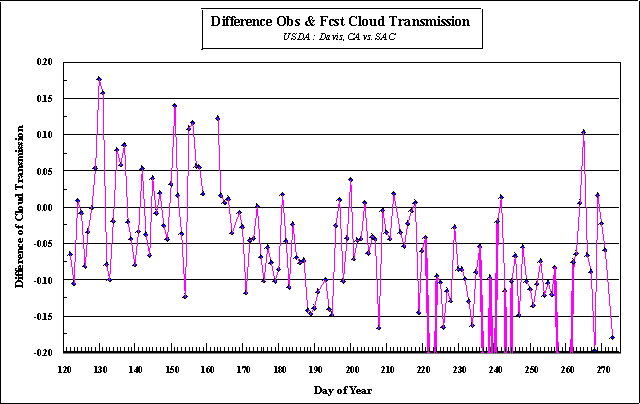
of the obserations and forecast values around day 190. Ratios of the normaled
observations and forecasts are shown in Figure 9. Ratios are centered near
the zero line to about day 160. The ratios following consistenly lower
implying a calibration shift.

Figure 9
Previous: Multiple Comparisons at one Local Next:Conclusions Up: Ext. Abst.