Previous: Introduction Next: Characterization Factors Up: Ext. Abst.
Overview
As the NWS strives to improve the accuracy of the UV Index, it remains
an excellent independent source of comparison for surface UV observations.
The UV Index is a dose rate of erythemally weighted UV irradiances. The
U.S. National Weather Service (NWS) produces a daily forecast of the UV
Index for the following day valid during the local solar noon hour for
nearly 800 U.S. cities(Long, et al., 1996). Total ozone forecasts based
upon observations from NOAA satellites, cloud forecasts from NCEP numerical
models provide the necessary input for the daily UV Index forecasts. No
surface UV observation information is used in the generation of the daily
forecasts.
There are no less than seven networks taking surface UV radiation observations
operated by various governmental agencies. Each network has its own specific
purpose. Which directs the locations of the surface sites. For this exercise,
three of the larger networks were chosen: USDA, NOAA's SURFRAD, and EPA's
UVnet.
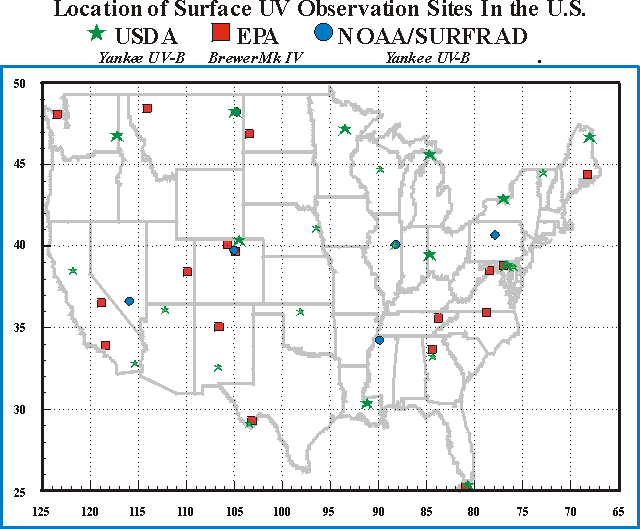
The USDA and the SURFRAD networks use the Yankee UV-B broadband instrument
to make their surface observations. The EPA uses the spectral Brewer Mk
IV. More information about these instruments can be found at the networks
home pages.
Figure 1 shows the location of the three networks' sites within the contiguous 48 states. Note that there are several locals where more than one network is located. This offers the chance for inter-comparison of the observations.
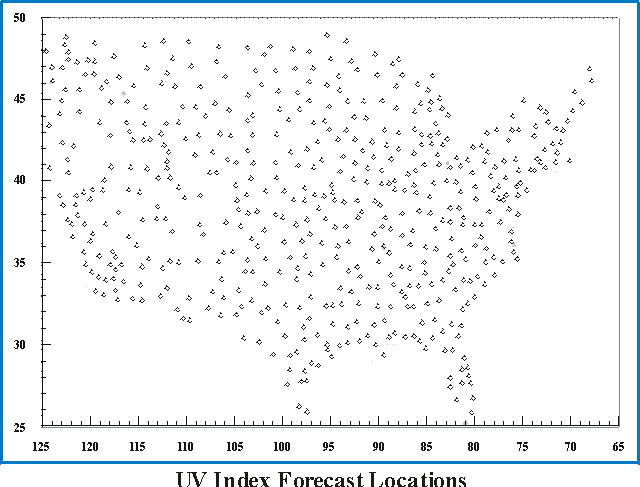
Figure 2 shows the locations of nearly 800 cities where the UV
Index forecasts are issued. Stations closest to the surface observation
sites are used for this comparison. Some parings of UV observation site
and UV forecast city have small distances between them. While others, especially
for the sites in National Parks, are much further away.
Previous: Introduction Next: Characterization Factors Up: Ext. Abst.