Changes in Antarctic UV levels in relation to ozone hole characteristics

G. Bernhard, C.R. Booth, and J.C. Ehramjian

Biospherical Instruments Inc., San Diego, USA (nsfdata@biosperical.com)


Note: All viewgraphs that have been presented at the SPARC 2000 meeting, including complementing explanations, can be found at www.biospherical.com/nsf/presentations.asp. Data from the network can be requested by visiting www.biospherical.com.


FIGURES


ABSTRACT

The United States National Science Foundation's Polar Programs UV Monitoring Network is currently in its thirteenth year of operation. Austral network sites include the Antarctic sites South Pole (90°S), McMurdo (78°S), and Palmer Station (65°S), as well as Ushuaia (55°S) in Argentina. The data series from these stations are now sufficiently long to investigate changes of high austral latitude UV climate in relation to ozone depletion beyond year-to-year variability.

The study is based on

  • Total column ozone data from TOMS/NASA onboard Nimbus-7, Meteor-3, and Earth Probe satellites, and TOVS/NOAA data from the years 1995 and 1996.
  • Daily "CIE" and "Setlow"- doses derived from data of the NSF UV Network for the period 1989-2000.

The NSF UV Network deploys SUV-100 spectroradiometers, built and maintained by Biospherical Instruments. Measurements of global spectral irradiance between 280 and 600 nm are sampled quarter-hourly. The instruments' bandwidth is approximately 1 nm. See our website for a comprehensive description of the radiometers and data products. For this study, measured irradiance spectra were weighted with two different action spectra, the CIE action spectrum for erythema (sunburn) [McKinley and Diffey, 1987], and the action spectrum suggested by Setlow [1974], which describes the spectral dependence of UV irradiation to cause damage to DNA. Both CIE- and "Setlow"-weighted irradiances were integrated over periods of 24 hours to calculate daily CIE and "Setlow"-doses. (Daily doses are a new data product, available on our website).

A comparison of the ozone and UV climatology at the four network sites reveals that the minimum values of total column ozone occur during the months September and October, when the "ozone hole" is fully developed. In contrast, maximum values of CIE and "Setlow"-doses were observed in November and December, months usually regarded as "post ozone hole".

The ozone dataset for all sites but Ushuaia reveals further that the "date of disappearance" of the ozone hole (defined as the last day in a given year when ozone levels were below 220 DU) occurred in recent years approximately 30-40 days later than in the early 1980s. For example, in the early 1980s, ozone values below 220 DU were rarely observed after November 10, whereas during the last years, ozone below this threshold have been measured in December. This has large consequences on surface UV doses due to the higher solar elevations later in the year.

We estimated the possible effect of the trend in the "date of disappearance" on daily CIE and "Setlow" doses utilizing calculations performed with the radiative transfer model UVSPEC [Mayer et al., 1997]. Clear-sky daily doses were modeled for each day of the year for all network sites, assuming an ozone column of 220 DU. The annual cycles of the modeled doses suggest that on the last day of a year, when ozone was below 220 DU, Setlow UV doses at Palmer were a factors of 1.8 higher in recent years than in the early 1980s. Corresponding factors for McMurdo and South Pole are 3.1 and 4.8, respectively. The same calculation for daily CIE doses resulted in factors of 1.6, 2.4, and 3.2 for Palmer, McMurdo and South Pole. These model results indicate that a main cause for UV trends in Antarctica is the delayed recovery of ozone depletion. Moreover, the highest trends in UV should be expected in November, because this month was only little affected by diminished ozone values in the early 1980s, whereas severe ozone depletion is frequently observed in recent Novembers.

In order to determine trends in UV, the monthly means of the daily CIE and "Setlow"-doses were calculated for the months September through October when data from the network were available (Months with more than five days missing were discarded from the analysis). Trends were determined by linear regression analysis. A trend was regarded significantly different from zero when

|s/serr| > t(y-2, 0.0455) with:

s = Scale factor of linear regression

serr = Standard deviation of scale factor

y = Number of years included in regression

t(y-2, 0.0455) = Value of Student t-distribution with degree of freedom y-2 and probability 0.0455

Note that t(y-2, 0.0455) is approximately 2 for large y. Significance of trends is therefore based on the 2s-level. Note further that regression statistics, assuming normal distribution, is not the most appropriate model to estimate trends in environmental data. The application of more realistic, but far more complicated, statistical models, which consider also the existence of autocorrelation, natural cycles, instrument drift, etc., would likely result in trend estimates that are less significant than trends indicated here.

Trend estimates for all sites and months are compiled in Table 1, together with the correlation coefficients R2. Trends range between ­40±55% / decade (daily "Setlow"-dose for Ushuaia in October) and +162±180% % / decade (daily "Setlow"-dose for South Pole in November). Largest positive trends are generally observed in November, with the exception of Ushuaia. However, most trends are not significant at the 2-sigma level, primarily due to the large year-to-year variability in total column ozone; the second reason is cloud variability. The only exceptions of significant trends are the trends in daily CIE dose for Palmer in November and South Pole in October.

Table 1: Trend estimates in daily CIE and "Setlow"-doses.

Site Month Daily CIE dose Daily "Setlow" dose
Trend (% per decade) R2 Trend (% per decade) R2
McMurdo Sep 28±31 0.40 55±60 0.42
Oct 11±45 0.05 23±80 0.06
Nov 38±55 0.25 96±122 0.03
Dec 14±29 0.19 27±53 0.22
Palmer Sep 38±48 0.27 74±86 0.31
Oct 11±57 0.02 15±79 0.02
Nov 59±54 0.38 94±105 0.29
Dec 25±42 0.18 34±67 0.14
South Pole Oct 41±39 0.54 88±89 0.51
Nov 67±73 0.41 162±80 0.40
Dec 34±38 0.45 76±93 0.42
Ushuaia Sep 11±23 0.14 16±46 0.08
Oct -20±34 0.26 -40±55 0.35
Nov -1±41 0.00 1±71 0.00
Dec 11±15 0.31 19±24 0.35
It has been shown that the relationship between changes in column ozone and concurrent changes in biologically weighted irradiance can be expressed by Radiation Amplification Factors (RAF) [Booth and S. Madronich, 1993]. We confirmed with UVSPEC model calculations that the RAF for "Setlow"-weighted irradiance is 2.25±0.2 for solar zenith angles (SZA) above 40 degrees and column ozone between 150 and 500 DU (For smaller SZA the value of 2.25 can still be used as long as ozone values are higher than 200 DU). Because of this small dependence of the "Setlow"-RAF on SZA and ozone, it is appropriate to remove the ozone-related variability in daily "Setlow"-doses by applying the RAF value of 2.25 for all days, regardless of the prevailing ozone value and zenith angles.

This is demonstrated with Figures 1-3. Figure 1 shows the annual cycle of the daily "Setlow"-dose as measured by the NSF UV Network instrument at the South Pole. Figure 2 shows the Radiation Amplification (RA) calculated from TOMS and TOVS ozone values by applying the RAF value 2.25. The amplification is referenced to a ozone column of 220 DU; days with 220 DU result in RA=1, days with ozone < 220 DU lead to RA > 1. As can be seen, RA values vary by a factor of 10 between March and October, i.e. variation in ozone leads to a 10-fold increase in UV between these two months. Figure 3 finally shows the quotient of daily "Setlow"-dose and RA. The ozone-related spike seen in Figure 1 is almost completely removed in Figure 3, indicating that the RAF formalism can well explain the variability seen in the UV measurements. Remaining fluctuations are likely caused by ozone variations during the day (which cannot be resolved by TOMS), and cloud influence. Similar plots have been prepared for all sites and can be found on our website. They show that ozone and cloud influence vary largely from site to site.
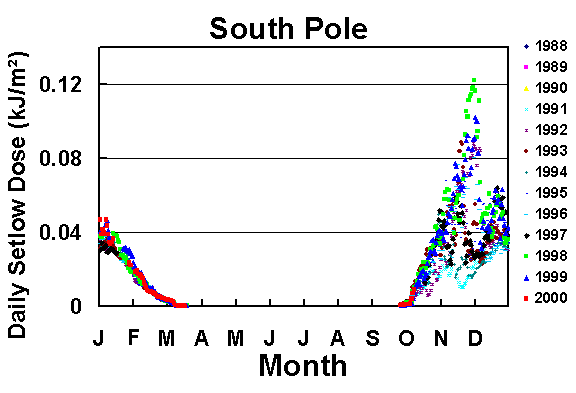
Figure 1: Daily "Setlow"-dose as measured by the NSF UV spectroradiometer at the South Pole.
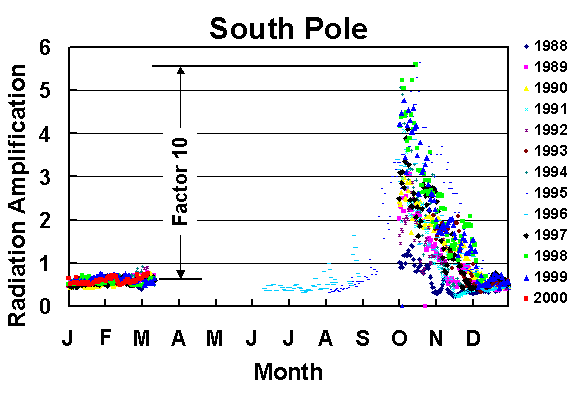

Figure 2: Radiation Amplification (RA) calculated with TOMS and TOVS ozone data for "Setlow"-weighting. Days with 220 DU result in RA=1. A Radiation Amplification of 2 on a given day means that "Setlow"-weighted UV is expected to be higher by a factor of two because of the deviation in column ozone on that day from 220 DU.
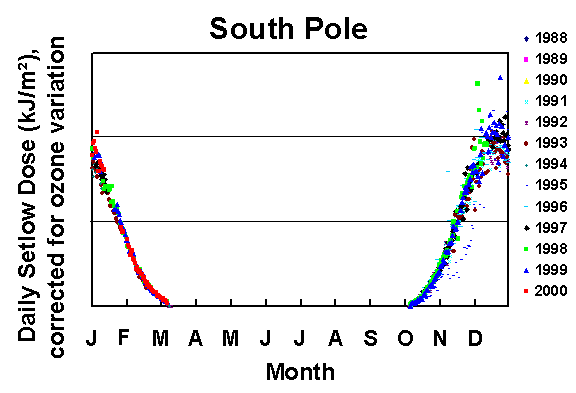

Figure 3: Measured "Setlow"-dose divided by the Radiation Amplification of Figure 2. The shape of the curve is smoother than in Figure 1, indicating that most of the variation in UV can be explained by ozone variability.


The largest daily UV doses measured at South Pole occurred on 30-Nov-1998 (see Figure 1). They were caused by low ozone values and the comparatively high solar elevation prevailing during this part of the year. Similar conditions were observed at Palmer on 7-Dec-1998 and one day later at Ushuaia. TOMS ozone maps confirm that the comparatively low ozone values observed on these days occurred when the vortex became unstable and ozone depleted air masses moved toward South America. This indicates that the influence of the ozone hole on populated regions is most severe when the vortex becomes unstable late in the year rather than when the largest ozone depletion occurs. An exception is September and October 2000, when the edge of the record-size ozone hole moved several times over Ushuaia. High UV doses were consequently observed on 12-Oct-2000, which were comparable to the record value measured on 8-Dec-1998 (Figure 4). Between 10-Oct-2000 and 12-Oct-2000 the daily CIE and "Setlow" doses increased by a factor of 2.5 and 5, respectively. This demonstrates that record UV levels may now also occur over populated regions early in the year because of the increase in the spatial extent of the ozone hole that has been observed during the last years.
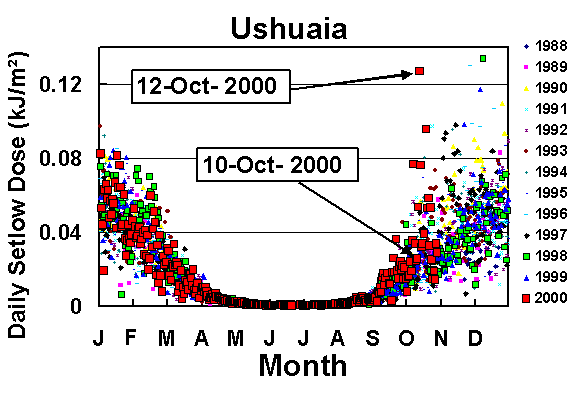
Figure 4: Daily "Setlow" dose at Ushuaia. The high value on 12-Oct-2000 occurred when the edge of the ozone hole moved over Ushuaia.

Acknowledgements:

The United States National Science FoundationÕs Polar Programs UV Monitoring Network was established under the guidance of P. Wilkniss, former Director of the Office of Polar Programs. The network is operated and maintained by Biospherical Instruments under a contract from the NSF Office of Polar Programs (Dr. Polly Penhale) via Raytheon Polar Services Company. TOMS (Total Ozone Mapping Spectrometer) data used here were made available by NASA/GSFC, see toms.gsfc.nasa.gov. TOVS (TIROS-N Operational Vertical Sounder) are a courtesy of NESDIS Satellite Research Laboratory, NOAA, and were kindly made available to us by A. C. Neuendorffer.

References:

Booth, C.R., and S. Madronich, "Radiation amplification factors: improved formulation accounts for large increases in ultraviolet radiation associated with Antarctic ozone depletion", Antarctic Research Series, edited by C.S. Weiler and P.A. Penhale, 62, 39-42, 1993.

Mayer B., A. Kylling, and G. Seckmeyer, "Systematic long-term comparison of spectral UV measurements and UVSPEC modeling results," J. Geophys. Res., 102, D7, 8755-8767, 1997.

McKinley, A.F. and B.L. Diffey, "A reference action spectrum for ultraviolet induced erythema in human skin," CIE Research Note, 6, No. 1, 1987.

Setlow, B., "The wavelength in sunlight effective in producing skin cancer: a theoretical analysis," Proc. Nat. Acad. Sci., 1, No. 9, pp. 3363-3366, 1974.


Back to

Session 1 : Stratospheric Processes and their Role in Climate Session 2 : Stratospheric Indicators of Climate Change
Session 3 : Modelling and Diagnosis of Stratospheric Effects on Climate Session 4 : UV Observations and Modelling
AuthorData
Home Page