Response of the MA-ECHAM/CHEM model to solar forcing: first results
of a fully interactive model study
K. Tourpali(1), R. van Dorland(2), C. J. E. Schuurmans(1)
(1) Institute for Marine and Atmospheric Research Utrecht(IMAU),
The Netherlands
(2) Royal Netherlands Meteorological Institute, The Netherlands
B. Steil, C. Bruehl
Max-Plank-Institute fur Chemie, Mainz, Germany
FIGURES
Abstract
The extent to which solar activity is a factor in climatic change
is still a matter of debate. In this study the response of ozone
and tropopause pressure to solar UV radiation changes in combination
to variations of the solar constant resulting from the 11 - year
solar cycle is investigated using the global three-dimensional
dynamic-chemical model MA-ECHAM4/CHEM. The general circulation
model (MA-ECHAM4), an extended upward version of ECHAM4 with the
top at 0.01 hPa, has been interactively coupled to the tropospheric
and stratospheric chemistry module CHEM. The coupled model employs
interactive photochemistry and includes heterogeneous reactions
on PSCs and sulphate aerosols. Preliminary results on ozone distribution
changes due to the 11-year solar cycle are presented, along with
zonal tropopause pressure changes, resulting from the interactive
stratospheric ozone, radiation and dynamics changes as depicted
in the model.
1. Model description
MA-ECHAM/CHEM is a spectral General Circulation Model with interactive
chemistry from surface to a height of about 80 Km, based on the
'Middle Atmosphere version of the European Centre model in HAMburg'
(Roeckner et al, 1996). The horizontal resolution is T30, with
39 vertical layers (top at 0.01 hPa) and time step set to 15 minutes.
The model incorporates the parameterisation of gravity wave effects
from Manzini and McFarlane (1998) and uses the Spitfire advection
scheme.
The chemistry module CHEM (Steil et al, 1998) contains chemical
processes required to describe stratospheric ozone chemistry and
tropospheric background chemistry. 18 species are transported
individually or as families, and diagnostic methane oxidation
is calculated. 110 photochemical reactions are taken into account,
and the photolysis rates are calculated 'on-line' using the accurate
and computationally effective scheme of Landgraf and Crutzen (1998)
which also includes changes in clouds and ozone. The concentration
of the long lived species is prescribed at the surface, while
for the short lived species their emissions and dry deposition
are prescribed also at the surface. At the top, only the NOx concentration
is prescribed using observations from UARS/HALOE, varying with
latitude, height and season. Heterogeneous reactions on Polar
Stratospheric Clouds (PSCs) of type I and II and on sulphate aerosol
are included. The model is fully interactive, i.e. changes in
chemistry have a feedback into dynamics through their influence
on radiation.
2. Experiment design
Our experiment aims at investigating the effects of enhanced solar
UV radiation on climate. For this purpose, 2 separate runs of
the model are being performed, lasting for 20 model years. The
first model run represents conditions prevailing at the state
of maximum solar activity during the sun's 11-year cycle, with
enhanced solar irradiance mainly at the UV intervals, while the
second run represents minimum solar activity conditions.
The basic state of the model, an 'average' state of the 11-year
solar cycle, is a simulation of the present-day atmosphere, representing
a time-slice for 1990, with carbon dioxide concentration set to
353 ppmv and chemical boundary conditions for 1990. The Sea Surface
Temperature (SST) is fixed in the model, representing a 1974 -1994
climatology. The runs are performed from re-start files from a
60-year model run.
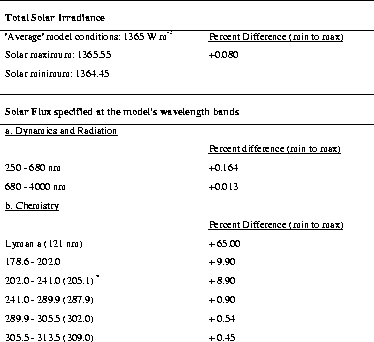
The solar fluxes in both perturbation runs were adjusted in the
model's spectral intervals according to the difference between
the solar minimum and solar maximum spectral solar flux changes
(Lean et al., 1997). The changes are summarised in Table 1. Maximum
solar activity is represented by enhanced solar flux distributed
within the radiation scheme spectral intervals and enhanced solar
flux distributed at the wavelength bands used for the photolysis
rate calculations.

Table 1. Changes in Solar Flux
(* The number in parenthesis is the fixed wavelength at each spectral
interval used in the photolysis rate calculation scheme. See Landgraf
and Crutzen, 1998, for details)
3. Discussion
Our preliminary analysis here presents results from the first
5 and half years of the model runs. As our initial conditions
from the re-start files represent late April conditions, the first
18 months of the model simulation are considered here as a spin
up period for the model calculation and are therefore omitted
from the analysis.
The first topic to consider is the changes in the ozone field,
as solar induced changes in the chemical module of the model alter
ozone production, and with the feedback from chemistry to the
GCM's dynamics various chemical, radiative and subsequent dynamical
processes are involved.
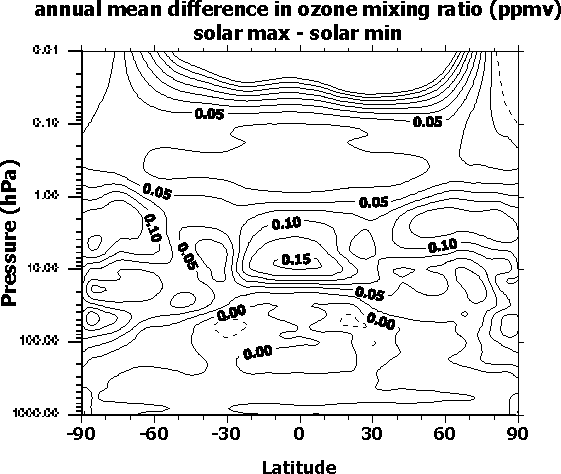
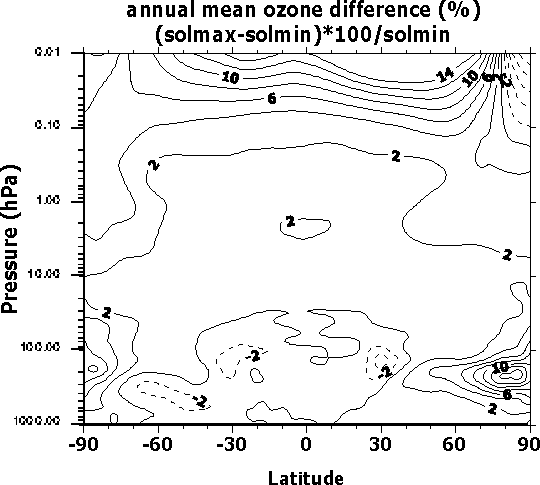
Figure 1 presents the changes in the ozone field between maximum
and minimum solar activity conditions with respect to the 11-year
solar cycle, as annual average of the last 3 years of the model
simulation at each state of the model. The top panel shows the
absolute changes in ozone mixing ratio (in ppmv), and the bottom
panel shows the change in percent [100*(solar max - solar min)/
solar min)]. These changes, positive over all the stratosphere,
with a maximum in absolute change in the area of ozone concentration
maximum, are consistent with changes between solar maximum and
solar minimum conditions as calculated by the Mainz 2D chemistry
model (Bruehl, 1999). These preliminary results are also in reasonable
agreement with observed changes (e.g. SPARC, 1999). Negative upper
tropospheric changes mainly in the tropical region indicate that
dynamics play an important role in modulating the ozone field
in that region, changing the shape and possibly the intensity
of the Hadley cell circulation, a result reported from earlier
GCM simulations of the solar activity forcing, using prescribed
ozone changes.


Figure 1 (see text)
The anomalies observed in the lower stratosphere and upper troposphere
region of the model suggest that the tropopause region is influenced
by solar flux changes and the subsequent ozone, radiation and
dynamics changes. Recent results from observation analysis (Zerefos
et al., 2000) show that the tropopause temperature is varying
in accordance with the solar cycle, although recent volcanic eruptions
may also play an important role. The volcanic eruptions happened
to have occurred at the last two solar cycle maxima, and their
effect in the lower stratospheric temperature is in synergy with
the solar activity for the last two solar cycles. As our model
does not include volcanic aerosol effect and SST changes, a direct
comparison between model and observation results in tropopause
pressure is extremely complicated.

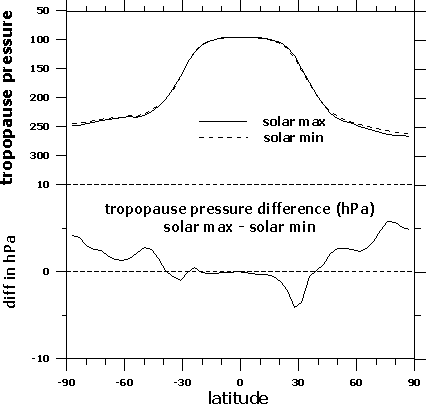
Figure 2:Average annual tropopause pressure in years with solar maximum
and solar minimum activity.
However, a preliminary result from our analysis, presented in
Figure 2, shows a weak response in the tropical region, and a
stronger response in the vicinity of about 30N, at the area of
the descending branch of the Hadley cell, indicating a stretching
of the northern branch of the cell during periods of maximum solar
activity. The high response seen over the high latitude and polar
regions, mainly in the northern hemisphere, could be subject to
changes as more model years will be added to the analysis, due
to high variability in these regions of the world.
4. References
Landgraf J. and P. J. Crutzen, An efficient method for 'on-line'
calculations of photolysis and heating rates, J. Atmos. Sci.,
55, 863-878, 1998
Lean, J. G. J. Rottman, H. L. Kyle, T. N. Woods, J. R. Hickey,
and L. C. Pugga, Detection and parameterisation of variations
in solar mid-and-near-ultraviolet radiation (200-400nm), J. Geophys.
Res., 102, 29939-29956, 1997
Manzini, E., and N. A. McFarlane, The effect of varying the source
spectrum of a gravity wave parameterisation in a middle atmosphere
general circulation model, J. Geophys. Res., 103, 31523-31539,
1998
Rroeckner, E., K. Arpe, L. Bengtsson, L. Christoph, M. Claussen,
L. Dumenil, M. Esch, M. Giorgetta, U. Schlese, U. Schultzweida,
The atmospheric General Circulation Model ECHAM-4: Model description
and simulation of present-day climate, Report 218, Max-Plank-Institute
for Meteorology, Hamburg, 1996
Steil B., M. Dameris, C. Bruehl, P. J. Crutzen, V. Grewe, M. Ponater
and R. Sausen, Development of a chemistry module for GCMs: first
results of a multi-annual integration, Annales Geophysicae, 16,
205-228, 1998
Zerefos, C. S., K. Tourpali, I. S. A. Isaksen, and C. J. E. Schuurmans,
Long term solar induced variations in total ozone, stratospheric
temperatures and the tropopause, Adv. In Space Res., 2000 (in
press)
Back to


