Previous: Experiment design Next: References Up: Ext. Abst.
3. Discussion
Our preliminary analysis here presents results from the first
5 and half years of the model runs. As our initial conditions
from the re-start files represent late April conditions, the first
18 months of the model simulation are considered here as a spin
up period for the model calculation and are therefore omitted
from the analysis.
The first topic to consider is the changes in the ozone field,
as solar induced changes in the chemical module of the model alter
ozone production, and with the feedback from chemistry to the
GCM's dynamics various chemical, radiative and subsequent dynamical
processes are involved.
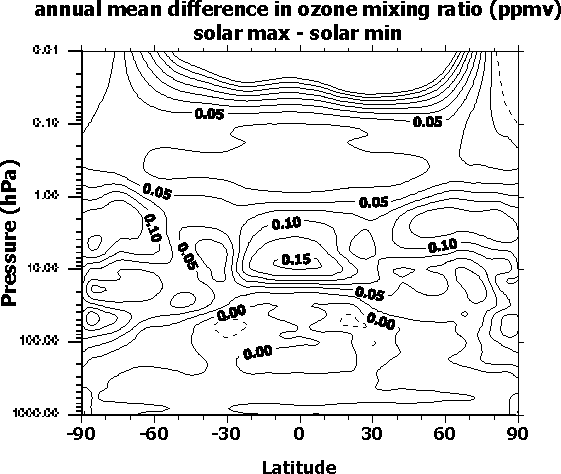
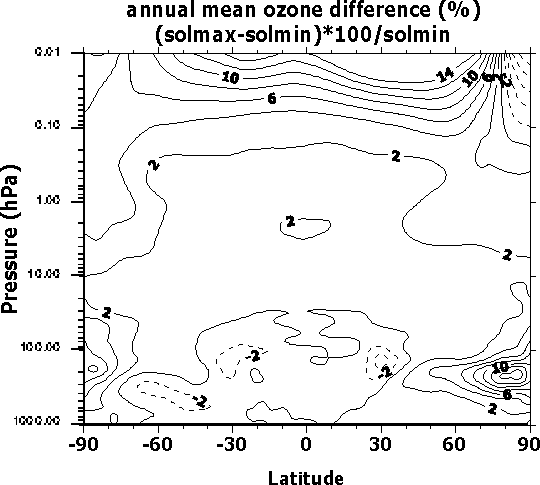
Figure 1 presents the changes in the ozone field between maximum
and minimum solar activity conditions with respect to the 11-year
solar cycle, as annual average of the last 3 years of the model
simulation at each state of the model. The top panel shows the
absolute changes in ozone mixing ratio (in ppmv), and the bottom
panel shows the change in percent [100*(solar max - solar min)/
solar min)]. These changes, positive over all the stratosphere,
with a maximum in absolute change in the area of ozone concentration
maximum, are consistent with changes between solar maximum and
solar minimum conditions as calculated by the Mainz 2D chemistry
model (Bruehl, 1999). These preliminary results are also in reasonable
agreement with observed changes (e.g. SPARC, 1999). Negative upper
tropospheric changes mainly in the tropical region indicate that
dynamics play an important role in modulating the ozone field
in that region, changing the shape and possibly the intensity
of the Hadley cell circulation, a result reported from earlier
GCM simulations of the solar activity forcing, using prescribed
ozone changes.


Figure 1 (see text)
The anomalies observed in the lower stratosphere and upper troposphere
region of the model suggest that the tropopause region is influenced
by solar flux changes and the subsequent ozone, radiation and
dynamics changes. Recent results from observation analysis (Zerefos
et al., 2000) show that the tropopause temperature is varying
in accordance with the solar cycle, although recent volcanic eruptions
may also play an important role. The volcanic eruptions happened
to have occurred at the last two solar cycle maxima, and their
effect in the lower stratospheric temperature is in synergy with
the solar activity for the last two solar cycles. As our model
does not include volcanic aerosol effect and SST changes, a direct
comparison between model and observation results in tropopause
pressure is extremely complicated.

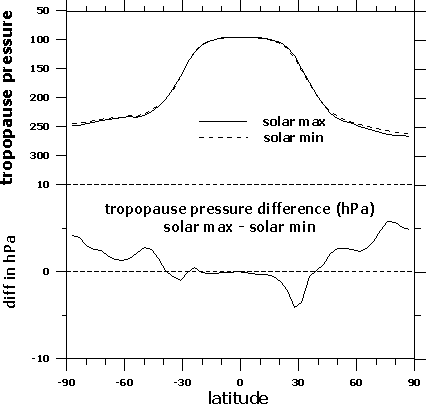
Figure 2:Average annual tropopause pressure in years with solar maximum
and solar minimum activity.
However, a preliminary result from our analysis, presented in
Figure 2, shows a weak response in the tropical region, and a
stronger response in the vicinity of about 30N, at the area of
the descending branch of the Hadley cell, indicating a stretching
of the northern branch of the cell during periods of maximum solar
activity. The high response seen over the high latitude and polar
regions, mainly in the northern hemisphere, could be subject to
changes as more model years will be added to the analysis, due
to high variability in these regions of the world.
Previous: Experiment design Next: References Up: Ext. Abst.


