Service d’Aéronomie / Institut Pierre Simon Laplace, France (keckhut@aerov.jussieu.fr)
Laboratory for Hydrospheric Physics, NASA Goddard Space Flight Center, Wallops Flight Facility, Virginia, USA.
Climate Analysis Center, NCEP/NOAA, Washington, DC, USA
Meteorological Research Institute Nagamine, Tsukuba, Ibaraki 305, Japan.
Laboratoire de Physique de l’Atmosphère, La Réunion, France
FIGURES
Abstract
1. Introduction
Until recent times, the role of the coupled ocean-low atmosphere
system was the only one to be considered in the climate studies.
Recently it has been recognised that one must take into account
the stratospheric behaviour in many aspects of the studies of
climate change. The dynamical, chemical and radiative processes
which occur in the stratosphere all influence climate. On the
basis of radiative transfer calculations, numerical simulations
of a CO2 increase reveal that cooling should be considerably greater
in the stratosphere and mesosphere than warming at the surface
and in the troposphere. In addition to the study of the stratosphere,
the vertical and temporal pattern of changes observed in the stratosphere
with ground-based profilers, may be used as a "fingerprint" of
various climate forcing. However, long data series in the middle
atmosphere are not numerous. Moreover, discontinuities that may
have occurred are a limited factor for trend estimates. Hereafter,
the methodology is described as well as the data requirements.
The instrumental changes for rockets, lidar and NCEP analyses
are reported with a particular emphasis on tidal interferences.
Some preliminary trend estimated are also reported.
2. Methodology and data requirements
Data analyses for trend detection are based on linear regressions.
The confidence of the trend coefficient depends upon the variance
of the difference between the data and the fit model. This residual
variability includes the short term fluctuations of the atmosphere
and the measurement noise. The confidence is related to this short-term
residual variance and to the length of the data set. In practice
in the atmosphere, two successive measurements are correlated
by the non-random changes such as waves. The determination of
the trend confidence interval can take into account this non-independence
data properties with autocorrelation coefficient. As more measurements
will not improve trend estimates, one can reduce the confidence
interval in reducing the residual atmospheric variance in averaging
successive measurements. The optimum interval depends upon several
factors and is somewhere between a week and a month.
However, the fundamental factor limiting our hability to detect
and quantify trends is the instrumental bias inducing changes
of the mean measurements. Most of the instrumental changes may
impact on the bias and may generated spurious changes which can
be interpreted as trends. So it is deeply recommended to well
documented any instrumental changes for efficient trend data analyses.
3. Tidal effects
Lidar data are restricted to night time and clear weather. Individual
lidar profiles are derived by integrating measurements taken during
the night over several hours. The integration period depends on
factors such as local cloud cover, measurement protocol, and
availability of the operator. The integration time for lidar measurement
at OHP should have induced residual temperature changes due to
tidal fluctuations. In the summer, stratospheric temperature tides
contain a diurnal cycle with an amplitude around the stratopause
of ±4 K (from minimum to maximum) peaking at 18:00 solar local
time (Keckhut et al., 1996). Temperature anomalies have been estimated
according to these tidal characteristics and the exact period
of the lidar sounding at OHP. The simulation shows tidal effects
associated with inter-annual changes smaller than 1K, with most
of the structure between 1986 to 1991. The overall residual, non
atmospheric trend for this period is smaller than +0.02 K per
decade.
A diurnal oscillation with a maximum at 14-15 hours (local time)
with an amplitude up to ±10 K around the stratopause has been
observed in the past with successive rocket measurements. This
effect is probably mainly due to sensor heating induced by solar
radiation, which causes amplitudes larger than natural tides.
Trend results appear to differ quite a bit when time of the measurements
is taken into account. For example, Ascension Island data base
(8°S) exhibits the largest cooling in the stratosphere with a
maximum around 4 K/decade at 40 km in disagreement with other
sites. The re-analysis of this data set, in selecting data minimising
the time of day variation of the measurement, reveals a very different
signature, smaller by a factor of two at 45 km in better agreement
with other tropical and subtropical rocket sites (Keckhut et al.;
1998).
Rayleigh lidar operating in the south of France during the same
periods were compared with the interpolated adjusted NCEP data
(Keckhut et al., 2000). Abrupt changes appear coincident sometime
with dates of satellite replacements, mainly at 2 and 1 hPa levels.
The NCEP stratospheric analyses are derived from one of two operational,
polar orbiting, sun synchronous satellites. One satellite has
its ascending equatorial crossing near 13:30 LT (afternoon satellite)
and the other its descending crossing near 7:30 LT . Adjustments,
based on rockets launched from US sites do not differentiate temperature
changes of instrumental origin versus deviations induced by the
portion of the diurnal cycle observed. As satellite orbits do
switch several times every 2-3 years, providing shifts of the
local time of the TOVS measurements over a single location. So
abrupt changes may appear for each switch of the orbit of the
satellite. Those bias prevent any inter-annual studies with the
upper stratospheric NCEP analyses.
4. Temperature trend observations
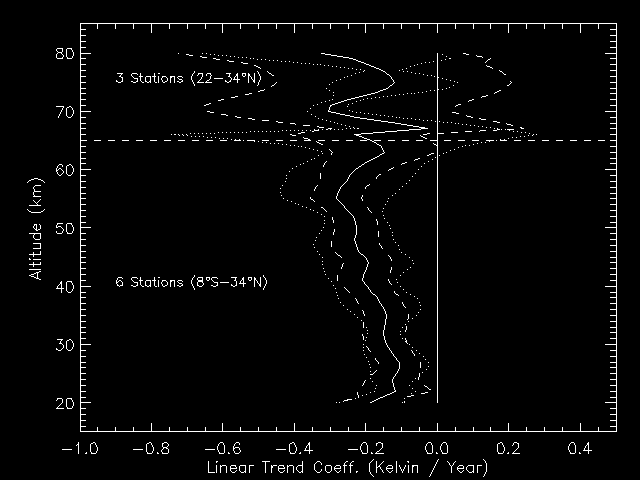
To be able to consider the potential effects of the various sensors and correction applied on rocket measurements, a sub-set of rockets have been composed to provide a homogenous temperature sets dividing into less than 2 or 3 periods including data exclusively obtained with the same sensor and analysed using the same correction type. The multi-parametric adaptive model used includes seasonal components (annual and semi-annual), a seasonal trend, a linear function related to solar activity (10.7 cm solar flux) and a seasonal function of the Quasi Biennial Oscillation. Also, this model include one or two step functions at some given dates when sensor or correction applied have been changed. In the stratosphere sudden changes associated with instrumental changes correspond to less than a few degrees. However above 55 km they sharply increase with altitude similar to the correction applied. Despite a global similar effect found which give some credit to this kind of analysis, those instrumental effects change slightly for one site to another as radiative effects are expected to differ with latitude and local time of rocket launches. Data have been selected according to the measurement time within ± 2 hours around the mean. This has slightly decreased the number of profiles by around 20%. For tropical and subtropical latitudes coherent trends have been obtained among the different locations: 1-2 K/decade in the upper stratosphere and of 2-3 K/decade above 55 km (Keckhut et al, 1998).

Figure 1- Temperature trend obtained from an average of 5 rocket sites: Kwajalein (9°N), Antigua (17°N), Barking Sands (22°N), Cape Kennedy (28°N) and Point Mugu (34°N)
Temperature data measured routinely by rockets at Ryori (39°N)
in Japan since 1970 are also analysed (Keckhut et al., 1999).
A significant cooling of 2.0 to 2.5 K/decade is observed. While
tropical and subtropical station do not exhibit a clear seasonal
dependence for the trend, the winter cooling tends to be minimum
around 40-45 km (even it tends to warm for December period) as
already observed in other data sets and simulated by models. However,
due to the increased variability with latitudes it is difficult
to investigate seasonal trend behaviour at high latitudes and
requires longer data series for significant trend estimates.
At mid latitude, lidar allow to obtained more frequent measurements
with nearly no extra cost permitting to lower down the natural
variability and a trend detection without increasing too much
the length of the data series. While instrumental changes and
the successive improvements may have induced spurious drifts mostly
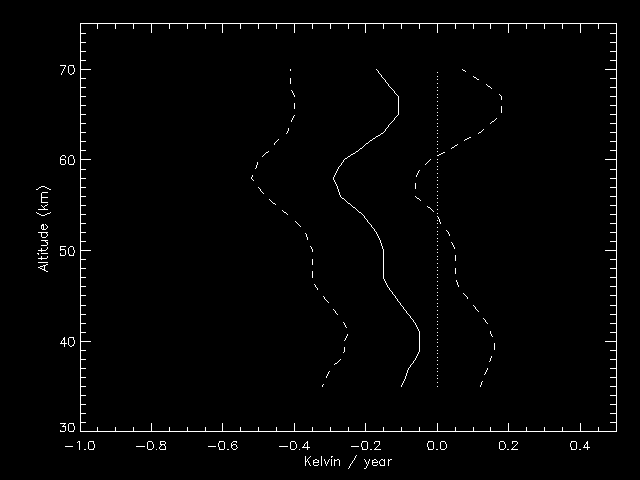
around 30-35 km and above 65-70 km, first trends have been estimated
(figure 2). Temperature trends are not yet significant in the
upper stratosphere. Larger and significant trends are observed
in the mesosphere (Keckhut et al, 1995).
Temperature trends observed from both rockets and lidar are in
relatively good agreement with numerical simulations (Ramaswamy
et al, 2001). Seasonal trend behaviours and finer comparisons
with numerical model will be provided within the Eurospice CEE
project.

Figure 2. Temperature trend as observed with Lidar at OHP from 1979 to
1997
References
Keckhut, P., A. Hauchecorne, and M.L. Chanin, Mid-latitude long-term variability of the middle atmosphere: trends, cyclic and episodic changes, J. Geophys. Res., 100, 18887- 18897, 1995.
Keckhut ,P., M.E. Gelman, J.D. Wild, F. Tissot, A.J. Miller, A. Hauchecorne, M.L. Chanin, E.F. Fishbein, J. Gille, J.M. Russell III, and F.W. Taylor, Semi-diurnal and diurnal temperature tides (30-55 km): climatology and effect on UARS-lidar data comparisons, J. Geophys. Res., special issue on UARS Data Validation, 101, 10299-10310, 1996 .
Keckhut, P., F.J. Schmidlin, A. Hauchecorne, and M.L. Chanin, Trend estimates from US rocketsondes at low latitude stations (8 S-34 N), taking into account instrumental changes and natural variability, J. Atmos. Sol. Terr. Phys., 51, 447-459, 1998.
Keckhut P., and K. Kodera, Long-term changes of the upper stratosphere as seen by rocketsondes at Ryori (39°N, 141°E), Annales Geophysicae,, 17,1210-1217, 1999.
Ramaswamy V., M.L. Chanin, J. Angell, J. Barnett, D. Gaffen, M. Gelman, P. Keckhut, Y. Kolshelkov, K. Labitzke, J-J. R. Lin, A. O’Neill, J. Nash, W. Randel, R. Rood, K. Shine, M. Shiotani, and R. Swinbank,Stratospheric temperature changes: observations and model simulations, Review of Geophysics, 2001 (on press).
Keckhut P., Wild J., Gelman M., Miller A.J., and Hauchecorne A., Investigations on long-term temperature changes in the upper stratosphere using lidar data and NCEP analyses, J. Geophys. Res., 2000.
Back to
| Session 1 : Stratospheric Processes and their Role in Climate | Session 2 : Stratospheric Indicators of Climate Change |
| Session 3 : Modelling and Diagnosis of Stratospheric Effects on Climate | Session 4 : UV Observations and Modelling |
| AuthorData | |
| Home Page | |