Previous: Tidal effects Next: References Up: Ext. Abst.
4. Temperature trend observations
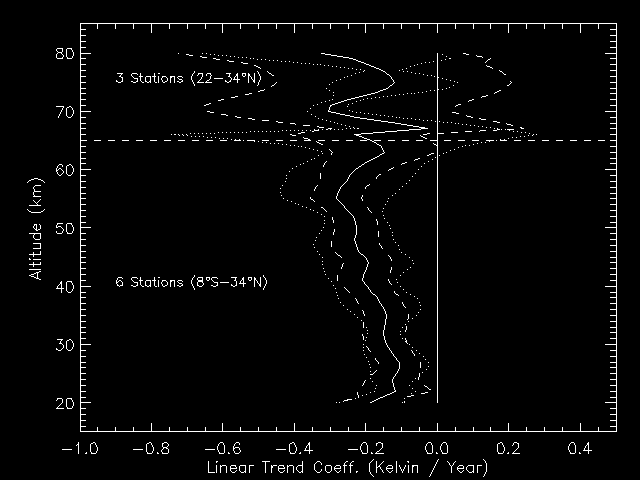
To be able to consider the potential effects of the various sensors and correction applied on rocket measurements, a sub-set of rockets have been composed to provide a homogenous temperature sets dividing into less than 2 or 3 periods including data exclusively obtained with the same sensor and analysed using the same correction type. The multi-parametric adaptive model used includes seasonal components (annual and semi-annual), a seasonal trend, a linear function related to solar activity (10.7 cm solar flux) and a seasonal function of the Quasi Biennial Oscillation. Also, this model include one or two step functions at some given dates when sensor or correction applied have been changed. In the stratosphere sudden changes associated with instrumental changes correspond to less than a few degrees. However above 55 km they sharply increase with altitude similar to the correction applied. Despite a global similar effect found which give some credit to this kind of analysis, those instrumental effects change slightly for one site to another as radiative effects are expected to differ with latitude and local time of rocket launches. Data have been selected according to the measurement time within ± 2 hours around the mean. This has slightly decreased the number of profiles by around 20%. For tropical and subtropical latitudes coherent trends have been obtained among the different locations: 1-2 K/decade in the upper stratosphere and of 2-3 K/decade above 55 km (Keckhut et al, 1998).

Figure 1- Temperature trend obtained from an average of 5 rocket sites: Kwajalein (9°N), Antigua (17°N), Barking Sands (22°N), Cape Kennedy (28°N) and Point Mugu (34°N)
Temperature data measured routinely by rockets at Ryori (39°N)
in Japan since 1970 are also analysed (Keckhut et al., 1999).
A significant cooling of 2.0 to 2.5 K/decade is observed. While
tropical and subtropical station do not exhibit a clear seasonal
dependence for the trend, the winter cooling tends to be minimum
around 40-45 km (even it tends to warm for December period) as
already observed in other data sets and simulated by models. However,
due to the increased variability with latitudes it is difficult
to investigate seasonal trend behaviour at high latitudes and
requires longer data series for significant trend estimates.
At mid latitude, lidar allow to obtained more frequent measurements
with nearly no extra cost permitting to lower down the natural
variability and a trend detection without increasing too much
the length of the data series. While instrumental changes and
the successive improvements may have induced spurious drifts mostly
around 30-35 km and above 65-70 km, first trends have been estimated
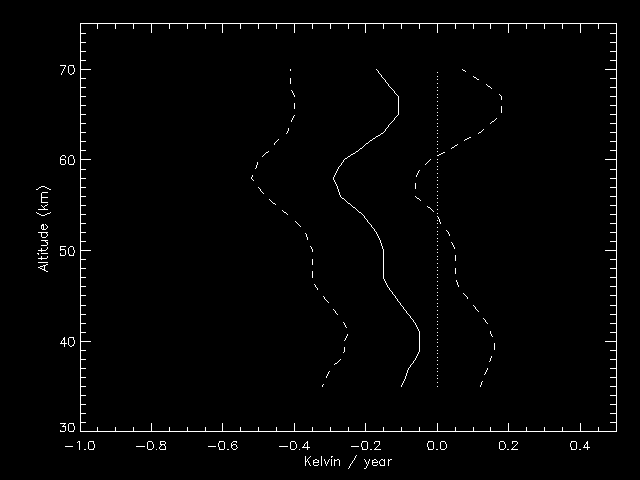
(figure 2). Temperature trends are not yet significant in the
upper stratosphere. Larger and significant trends are observed
in the mesosphere (Keckhut et al, 1995).
Temperature trends observed from both rockets and lidar are in
relatively good agreement with numerical simulations (Ramaswamy
et al, 2001). Seasonal trend behaviours and finer comparisons
with numerical model will be provided within the Eurospice CEE
project.

Figure 2. Temperature trend as observed with Lidar at OHP from 1979 to
1997