Previous: Analysis Next: Discussion Up: Ext. Abst.
Results
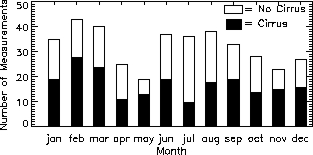
From 1997 to 1999 the lidar system made 384 nights of measurements. As seen in Figure 1, cirrus clouds are observed in half of the cases (54 %). The cirrus occurrence frequencies for spring, summer, winter, and fall are 57 %, 42 %, 57 %, 60 %, respectively.
Figure 1: A histogram of the number of cirrus occurrences and the total number of nightly measurements from 1997 - 1999 as a function of month.
Figure 2 shows the location of the cloud top heights for 1998 in relation to the tropopause; altitudes that correspond to - 25 ° C are also presented in the plot. A significant portion, 43 %, of the cirrus cloud top heights are within 0.5 km of the tropopause. In Figure 2 one sees, even with the daily variability of the tropopause height, the cirrus cloud tops tend to consistently track the tropopause. We use the WMO's definition of the tropopause (the altitude where the temperature lapse rate decreases to 2 K km-1 for at least 2 km). All temperatures are obtained from the radiosondes. Results for 1997 and 1999 are similar.
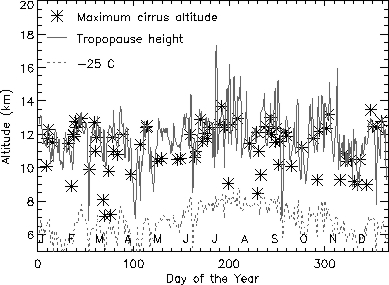
Figure 2: A profile of cirrus cloud top heights for 1998. Stars denote the maximum cirrus altitude, the solid line is the tropopause height and the dotted line marks altitudes that corresponds to - 25 C. The tropopause and - 25 C altitudes are determined from radiosondes measurements.
Table 1 summarizes the statistics for the cirrus cloud occurrence
frequency for individual layers and their total thickness for
the three years studied. A separation of 3 channels (corresponding
to 225 m) is needed for a new layer to be declared. The mean cirrus
thickness is 1.4 ![]() km and centered at 10.0
km and centered at 10.0 ![]() km, while the SVC are markedly thinner (0.8
km, while the SVC are markedly thinner (0.8 ![]() km) but are located in the same region (10.4
km) but are located in the same region (10.4 ![]() km).
km).
We present the optical thicknesses as a function of season in Figure 3; the results are binned on a log scale to better perceive the cases of very optically thin clouds. The SVC cloud occurance percentages for spring, summer, fall, and winter are 23 %, 18 %, 21 %, 25 %, respectively. When the mean for all three years is taken, cirrus with optical depths between 0.03 and 0.1 are the most prevalent. This pattern is similar for the annual results, except for 1998 where cirrus with optical thickness between 0.01 and 0.03 are as frequent than those between 0.03 and 0.1. The SVC cloud occurance varied from year to year, 22 % (1997), 27 % (1998), 17 % (1999).
| 1997 | 1998 | 1999 | 1997 - 1999 | |||||
| % Cloud Occurrence | ||||||||
| 1 layer | 36 | (13) | 38 | (20) | 30 | (8) | 36 | (14) |
| 2 layers | 14 | (7) | 14 | (5) | 21 | (9) | 16 | (7) |
| 3 layers | 4 | (2) | 2 | (2) | 1 | (0) | 2 | (2) |
| km | ||||||||
| Mean layer | 1.5 | (0.8) | 1.3 | (0.8) | 1.5 | (0.7) | 1.4 | (0.8) |
| thickness | ||||||||
| Stdev | 1.3 | (0.6) | 1.1 | (0.6) | 1.4 | (0.8) | 1.3 | (0.7) |
| No. of cirrus | 75 | (30) | 80 | (39) | 51 | (17) | 206 | (86) |
| occurences |
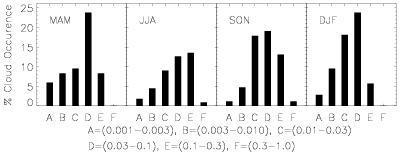
Figure 3: Histograms of cirrus seasonal optical thicknesses binned on a log scale. The first letter of each month is given in the upper left. Lettering along the absissa corresponds to optical thickness intervals, which are given above.