Envisat Taking up Duty of Atmospheric Composition Sounding
The European Space Agency’s GOMOS, MIPAS and SCIAMACHY Calibration and Verification Teams
Introduction
On the 1st of March 2002, the European Space Agency (ESA) launched Envisat, the largest Earth observing satellite ever built,
with an Ariane 5 rocket into its 800 km, sun-synchronous, polar orbit. Three of the ten instruments onboard Envisat are dedicated to the observation
of the atmospheric composition, namely, GOMOS, MIPAS and SCIAMACHY.
Since the launch, the instruments have undergone a variety of functional checks that aim at the verification of the overall
health status of the instruments, their commandability and the data downlink. During the calibration and validation phase, which is being conducted
in the period of one to nine months after launch, dedicated measurements are being acquired and analysed in order to verify or re-assess key
instrument performance parameters, for example, re-characterisation of detector non-linearity, instrument line shape, line-of-sight mispointing.
Once stable in-orbit measurement scenarios have been established, checks of critical on-ground algorithms will be performed, in order to identify
necessary corrections to processor components and to compile error budgets. Non-Envisat measurements of geophysical parameters will be
considered for first validations.
It is planned that around mid-July the first Level 1b and Level 2 data products will be released to the Atmospheric Chemistry
Validation Team (ACVT) for intensive geophysical validation supported by dedicated campaigns, e.g., involving balloon and aircraft measurements.
The Envisat data will be released to the user community once the Commissioning Phase and First Validation Phase have been completed.
In this article we present some first results of GOMOS, MIPAS and SCIAMACHY measurements. These results are, however,
not yet conclusive and should be considered as preliminary. More details on the calibration and validation can be found in the ‘Envisat Calibration
and Validation Plan’(
http://envisat.esa.int/support-docs/calval/CalVal.pdf).
GOMOS
The primary objective of the Global Ozone Monitoring by Occultation of Stars (GOMOS) instrument is monitoring of the
stratospheric and mesospheric ozone concentration with high accuracy via occultation of setting stars, providing comparable accuracy to solar
occultation measurements, but with full global coverage. Ozone is measured in the Hartley, Huggins and Chappuis bands with a UV-VIS grating
spectrometer (250-675 nm, 0.312 nm sampling, better than 1 nm resolution). The contiguous spectral coverage enables also observation of
NO2, aerosol extinction and possibly NO3 and OClO. Atmospheric density can be derived from oxygen A-band
measurements with a spectrometer covering 756-773 nm (0.2 nm resolution) and from Rayleigh scattering. Temperature can be derived with
very high vertical resolution from the analysis of atmospheric scintillation signals recorded with two fast photometers (1 kHz sampling frequency)
in the visible blue (470-520 nm) and red (650-700 nm) wavelength ranges. Furthermore, H2O will be observed by a second near-IR
spectrometer covering 926-952 nm. Level 1b data products are in particular atmospheric transmission spectra and associated variance. Level 2
data products are the retrieved geophysical data products, such as temperature and trace gas concentration and aerosol extinction profiles.
The vertical resolution of the measured species profiles depends on the occultation obliqueness and is better than 1.7 km.
The instrument’s line-of-sight can be pointed over a large contiguous range, reaching from the anti-flight
direction (-10º) to 90º in azimuth and from 68º to 62º with respect to the nadir direction. This enables GOMOS
to acquire a star outside and follow it through the atmosphere. The instrument and mission objectives are described in [1].
GOMOS observations started on 20 March, 2002. Currently, the instrument performs already more than 500 occultations
per day. The failure rate (due to loss of tracking) is currently below 2%. This happens with some faint (visual magnitude higher than 3) and hot
(temperature above 15000 K) stars (low visual magnitude means bright, high visual magnitude means faint star). Stars up to a visual magnitude
of 4.1 have been successfully tracked. Lowest tracking altitudes are below 10 km. The star detection threshold is currently under fine-tuning
in order to increase the potentially observable star range.
The objective of the GOMOS calibration activities, which are on-going, is a complete instrument calibration, including a
full in-flight calibration (e.g. band setting, wavelengths assignment) and re-characterisation of GOMOS (including non-linearity, pixel response
non-uniformity, dark charge map), a complete verification and upgrade of the Level 1b data processor, definition of the routine calibration
operations and observation plan. Four main tasks are being carried out in order to achieve this:
1) Verification of instrument health,
2) Derivation of instrument characteristics,
3) Validation and tuning of the Level 1b algorithm chain,
4) Level 1b data product verification.
The data product quality varies with the visual magnitude and temperature of the occulted star. Scattered sunlight
will furthermore degrade the measurements in the stratosphere and below on the orbit day side. An example of a stellar spectrum (of a
weak and hot star of magnitude 2.4 and temperature 28000 K) in the UV-visible channel of GOMOS is shown in
Figure 1. From this occultation of 6 May 2002, the derived atmospheric transmission in the
UV-visible is shown in Figure 2 for some tangent altitudes.
|
|
| Figure 1: Calibrated stellar spectrum in the UV-visible spectrometer.
The spectrometer is not specified in the region of 375-405 nm, therefore the spectrum is not calibrated in this region. |
(For a better resolution of the images, please click on the plot or contact the SPARC Office) |
|
|
Figure 2: Atmospheric transmission spectra measured on 6 May 2002 by occultation of a weak
and hot star (visual magnitude 2.41, temperature 28000 K). For clarity, only a subset of the measurements of this scan is shown with
the tangent altitudes indicated.
|
(For a better resolution of the images, please click on the plot or contact the SPARC Office) |
>GOMOS uses a two-step Level 2 retrieval approach. In a first step, the trace gas densities integrated along the line-of-sight
are being retrieved. In a second step, these “column densities” are converted into atmospheric profiles. The ozone absorption in the
Hartley band allows good mesospheric ozone retrievals, but blacks out rapidly as the instrument scans downwards in the upper stratosphere.
Absorption in the Huggins band is apparent, but most importantly, the strong Chappuis band signature enables ozone retrieval down to 20 km in
this case. Figure 3 shows the vertical profiles of ozone and NO2 derived from the transmittances
shown above. NO3 will also be retrieved but has not yet been analysed in detail. First comparisons with climatology data are indicating
very good agreement with GOMOS ozone, NO2 and air density measurements. Also GOMOS-GOMOS inter-comparisons of measurements
of the same air volume at subsequent orbits using different stars have shown very high consistency in the retrieved geophysical data products.
Furthermore, a first inter-comparison with a ground-based ozone lidar shows promising results (Figure 4).
|
|
| Figure 3: Atmospheric ozone and NO2 column density profiles along the line-of-sight (left) and local
density vertical profiles (right) retrieved from the transmissions shown in Figure 2. |
(For a better resolution of the images, please click on the plot or contact the SPARC Office) |
|
|
| Figure 4: Comparison of GOMOS retrieved ozone profile measured on 25 April 2002
with collocated lidar measurement at Observatoire de Haute Provence. |
(For a better resolution of the images, please click on the plot or contact the SPARC Office) |
Results of the retrieved atmospheric transmission with a bright and hot star (visual magnitude 0.61, temperature 28000 K)
is shown in Figure 5. The Huggins ozone absorption structures are obvious as well as NO2 absorption
structures. Ozone and NO2 retrievals are possible down to approximately 14 km. Good results can also be expected from the oxygen
A band measurements, even though the calibration and Level 2 analysis of the two near infrared channels (oxygen and water vapour) have not yet been
started.
|
|
| Figure 5: Atmospheric transmittances in the UV and visible measured by GOMOS on 6 May 2002
with a bright (visual magnitude 0.61) and hot (28000 K) star. NO2 absorption structures are clearly visible in this
measurement. The measurement tangent altitudes are indicated. |
(For a better resolution of the images, please click on the plot or contact the SPARC Office) |
Very promising are also first analysis results from the atmospheric scintillation measurements made with the two fast
photometers. Figure 6 shows the measured time delay in the two photometers and
Figure 7 shows the derived temperature profile with high resolution in comparison to the ECMWF analysis of
the same time and location.
|
|
| Figure 6:The measured time delay between the red and the blue signal as measured by
the GOMOS fast photometers (FP1 and FP2). This signal is being exploited for the retrieval of high-resolution temperature profiles. |
(For a better resolution of the images, please click on the plot or contact the SPARC Office) |
 |
| Figure 7: High-resolution temperature retrieval from GOMOS fast photometer measurements
(green curve, orbit 799, 25 April 2002) in comparison to collocated ECMWF analysis (blue curve). |
(For a better resolution of the images, please click on the plot or contact the SPARC Office) |
MIPAS
The primary objective of the Michelson Interferometer for Passive Atmospheric Sounding (MIPAS) is to advance the
understanding of the chemistry and dynamics of the stratosphere and upper troposphere as well as the stratospheric-tropospheric exchange.
It measures atmospheric limb emission spectra from which vertical profiles of atmospheric pressure, temperature and volume mixing ratios
of a number of trace gases are derived with a vertical coverage of nominally 6 km to 68 km. The primary target species are
O3, H2O, CH4, N2O, HNO3 and NO2.
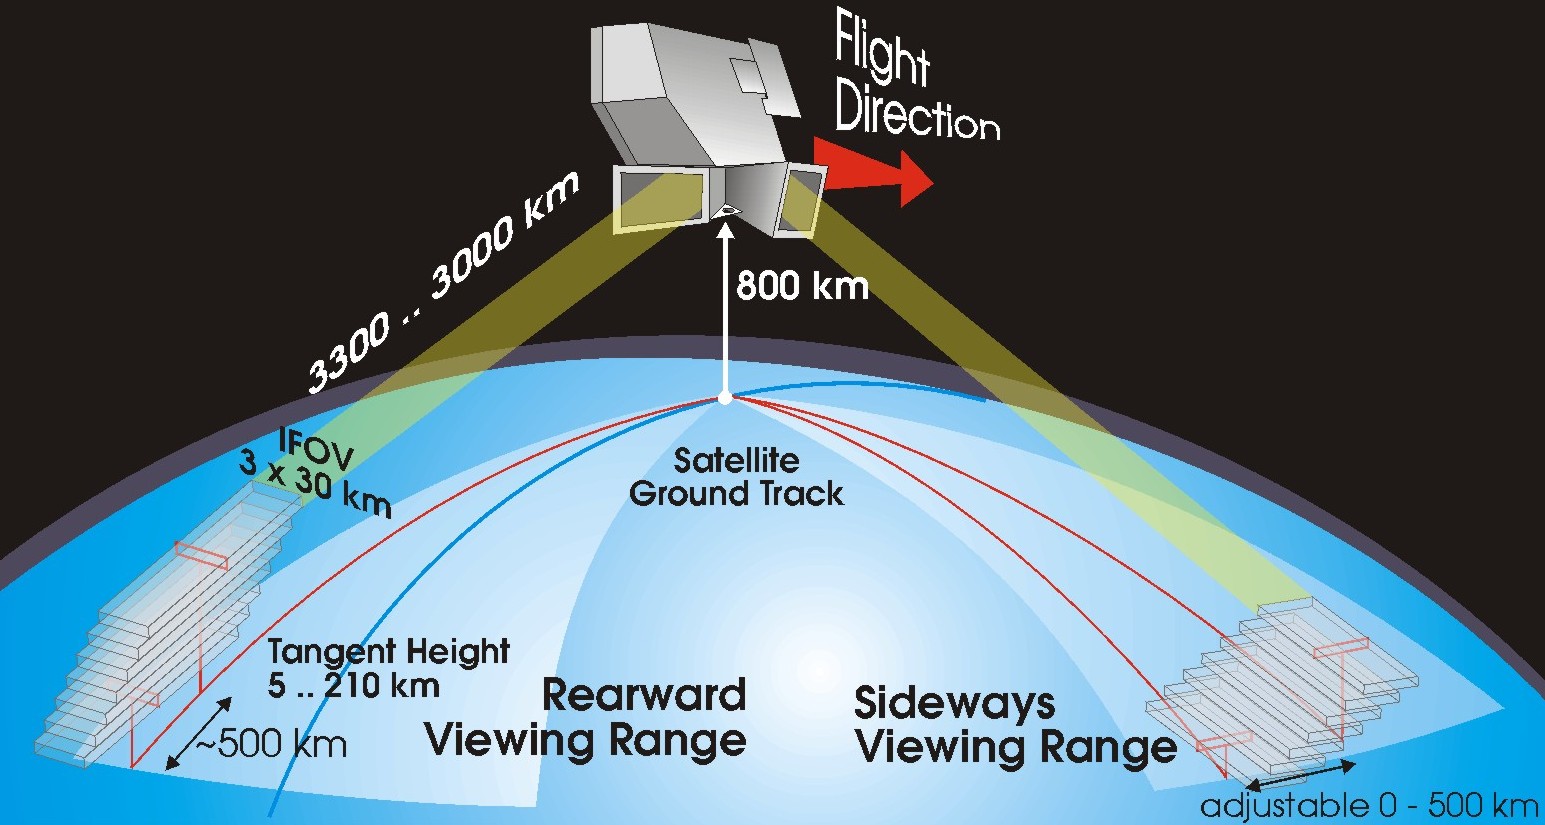
The instrument covers a broad spectral range, from 685-2410 cm-1 (14.6 to 4.15 micron) at high spectral resolution
(0.03 cm-1). The field of view at limb tangent point is 3 km (vertical) by 30 km (horizontal). The line-of-sight viewing range
is in the vertical 5 to 200 km (tangent height) and in the horizontal 35º about rearward (anti-flight) direction and 30º for
sideways viewing geometries.
The instrument and mission objectives are described in [2]. The viewing geometry is depicted in Figure 8.
|
|
| Figure 8: MIPAS viewing geometry. |
(For a better resolution of the images, please click on the plot or contact the SPARC Office) |
The MIPAS activities during the Commissioning Phase are:
1) Initial performance verification and update of instrument configuration and calibration,
2) Level 1b and Level 2 algorithm characterisation and verification,
3) Geophysical validation.
This paper focuses on first processing results of in-flight performance and Level 1b (collocated calibrated limb emission
spectra) and Level 2 (geophysical data products) data. The implemented Level 2 retrieval algorithm is based on the global fit approach.
The initial switch-on of the instrument and first data transmission took place on 24 March (orbit number 334). MIPAS appears fully functional
in flight. No serious hardware problems have been identified. Radiometric performance is excellent and very close to the performance model.
An initial check of the line-of-sight direction using a planetary source shows little deviation from the commanded value. Spectral parameters
such as resolution, linearity and stability have been verified to be within specifications.
Figure 9 shows calibrated stratospheric limb radiances in four spectrometer bands. Other trace gas
signatures of various trace gases used for temperature, pressure and trace gas profiles retrievals can be identified when zooming in as shown
in Figure 10. First temperature and ozone profile retrievals have been processed from orbit 504 (5 April 2002)
as shown in Figures 11 and 12, plotted together with their standard
deviations. Figure 13 shows the retrieved temperature profile over the full orbit 504. The vertical range
of the retrievals is 12-68 km. The ozone retrievals from the same data set are shown in Figure 14.
NO2 profiles are shown in Figure 15 and the HNO3 profiles, which show a
latitudinal concentration variation, are presented in Figure 16.
|
|
| Figure 9: MIPAS calibrated stratospheric limb radiances in four spectral bands,
measured on 24 March 2002, orbit number 334. The plots show both the real and the imaginary part of the spectrum.
The latter shows only noise structures as expected. The expected strong signature of ozone emission can be seen in band AB
around 1020 to 1070 cm-1 |
 |
| Figure 10: Emission lines of minor species seen clearly when zooming in the spectrum.
These spectra have been recorded by MIPAS on 24 March 2002, orbit 334. |
|
|
| Figure 11: First temperature retrieval with statistical error from measurements in
orbit number 504, 5 April 2002. |
|
|
| Figure 12: First ozone volume mixing ratio retrieval with statistical error from measurements
in orbit number 504, 5 April 2002. |
|
|
| Figure 13: MIPAS retrieved temperature profiles, orbit number 504. |
|
|
Figure 14: MIPAS retrieved ozone VMR profiles, orbit 504.
|
|
|
Figure 15: MIPAS NO2 VMR profile retrievals showing diurnal cycle, orbit 504.
|
|
|
Figure 16: MIPAS HNO3 VMR profile retrieval showing latitudinal variation in
HNO3 concentration. Orbit 504.
|
(For a better resolution of the images, please click on the plot or contact the SPARC Office) |
MIPAS data acquisition and analysis has started after the instrument switch-on 24 days after Envisat launch.
Full functionality of the instrument and excellent radiometric performance have been achieved, so that calibration and validation measurements
were started as planned on the 5th of April. A dedicated characterisation measurement period is currently ongoing with very encouraging results
of up to the Level 1b and Level 2 processing. So far, only minor routine modifications of the algorithms and auxiliary data were necessary.
Cloud detection turns out to be an essential part of the processing scheme. From July 2002 onwards, a stable Level 1b processing is expected
coinciding with the start of the first intensive balloon and aircraft geophysical validation campaign.
SCIAMACHY
<
The Scanning Imaging Absorption Spectrometer for Atmospheric Chartography (SCIAMACHY) is a cross-track scanning
double spectrometer, which can look at the atmosphere in either nadir or limb geometry, as well as via solar and lunar occultation.
The spectrometer covers eight channels:
1) 240-314 nm (0.24 nm resolution),
2) 309-405 nm (0.26 nm),
3) 394-620 nm (0.44 nm),
4) 604-805 nm (0.48 nm),
5) 785-1050 nm (0.54 nm),
6) 1000-1750 nm (1.48 nm),
7) 1950-2040 nm (0.22 nm),
8) 2265-2380 nm (0.26 nm).
The polarisation measurement devices have 7 channels:
1) 310-377 nm,
2) 450-525 nm,
3) 617-705 nm,
4) 805-900 nm,
5) 1508-1645 nm,
6) 2265-2380 nm,
7) 802-905 nm
The objective of SCIAMACHY is to measure a wide range of tropospheric and stratospheric constituents
(O3, H2O, CH4, N2O, NO2 will be systematically processed and distributed)
as well as temperature and aerosol.
SCIAMACHY data are processed, similar to GOMOS and MIPAS, into Level 1b (radiances) and Level 2 (geophysical products). Level 1b differs
from the GOMOS and MIPAS products insofar as the user has to apply the corrections and calibrations himself in order to obtain geo-located
calibrated radiance. This specific interpretation of Level 1b is based on the GOME (ERS-2) heritage, in order to have as much as possible raw
data information in the data product. Calibration software is delivered together with the Level 0 data. More information on SCIAMACHY mission
objectives and measurement modes can be found in [3].
The first steps in the calibration process are to verify the in-flight behaviour of the instrument. This will be achieved by analysing
measurements made with various on-board calibration sources as well as with sun, moon and atmosphere as calibration targets. Calibration
activities focus on the characterisation of:
1) Dark current,
2) Dead and bad pixels,
3) Etalon and pixel-to-pixel gain,
4) Spectral calibration,
5) Straylight,
6) Polarisation sensitivity,
7) Throughput.
This will lead to an update of the calibration auxiliary data before starting the Level 2 data geophysical validation.
During launch, the instrument is protected by three mechanical covers for the two mirrors and the radiant cooler.
First instrument functional tests after switch-on in mid-March made use of the on-board calibration lamps. After a first decontamination
of the optics, for which the instrument optical bench is heated up in order to release water vapour and other contaminants, this phase ended
with opening the azimuth mirror cover mechanism. Functional tests have continued and first atmospheric and solar measurements have been
taken in limb and occultation mode, respectively. At that stage the infrared channels could not be interpreted as they were not yet cooled
to operating temperature. After the radiant cooler has been activated, the instrument was cooled down to achieve its nominal operation temperature,
followed by characterisation measurements. In parallel with the first in-flight test, calibration data (dark current, spectral calibration and etalon
correction) have been analysed and their systematic and operational derivation has been started. This phase has been completed on 20 June 2002
with the opening of the last cover protecting the nadir port.
The status as of end of June is that all covers are released and the instrument is fully functional. The instrument temperature
(optical bench) and detector temperatures are nominal. All mechanisms are working. The wavelength calibration has been executed with expected
results (shift smaller than 1 pixel). Radiance response and leakage current are as expected.
Due to the much longer and more complicated commissioning procedure of SCIAMACHY compared to MIPAS and GOMOS, geophysical data and
spectra are more sparsely available.
Figure 17 shows the preliminarily calibrated solar reference spectrum acquired during
orbit number 814. A first comparison of ozone profile retrieval with GOME measurements is shown in Figure 18.
|
|
Figure 17: A preliminarily calibrated solar reference spectrum measured by SCIAMACHY
(red curve) during orbit number 814. The outliners and sharp spectral features are expected to disappear as soon as masking of bad
pixels and spectral calibration has been completed. The blue curve shows for comparison a solar spectrum from MODTRAN
|
|
|
Figure 18: A retrieved ozone profile (black line) from SCIAMACHY limb scan
measurements processed with the DLR limb prototype processor. The red line shows the initial guess used for the retrieval.
The green line shows an ozone profile retrieval from a collocated GOME (ERS-2) measurement (processed with the NGONG algorithm).
The observations have been taken over the Sahara desert (Envisat orbit number 913, 3 May 2002) with preliminary SCIAMACHY
calibration and 30 minutes time difference to the GOME observation.
|
(For a better resolution of the images, please click on the plot or contact the SPARC Office) |
Outlook
The first results of GOMOS, MIPAS and SCIAMACHY are very encouraging. The Commissioning Phase is currently going
on and will be concluded in September 2002. The initial Envisat validation will be completed by December.<:div>
Further information can be found at http://www.esa.int/ and
http://envisat.esa.int/
Acknowledgment.
The Instrument Calibration and Verification Teams of GOMOS, MIPAS and SCIAMACHY have contributed to this article. Members of the team are for
MIPAS: S. Bartha, M. Birk, B. Carli, M. Carlotti, T. v. Clarmann, J.C. Debruyn, A. Dudhia, J.M. Flaud, R. Gessner,
M. Hoepfner, J. Langen, M. Lopez-Puertas, P. Mosner, H. Nett, G. Perron, P. Raspollini, J. Remedios, M. Ridolfi, C.D. Rodgers, G. Schwarz;
GOMOS: G. Barrot, J.L. Bertaux, C. Cot, F. Dalaudier, O. Fanton d’Andon, R. Fraisse, O. Frauenberger,
D. Fussen, M. Guirlet, A. Hauchecorne, R. Koopman, E. Kyrölä, A. Mangin, L. Saavedra de Miguel, P. Snoeij, J. Tamminen, B. Theodore,
T. Wehr;
SCIAMACHY: I. Aben, B. Ahlers, W. Balzer, A. v. Bargen, J.P. Burrows, K. Chance, R. de Beek, A. Dehn, J. Frerick,
E. Hilsenrath, H. Kelder, R. Koopman, A. Piters, P. Simon, S. Slijkhuis, R. Spurr, P. Stammes, R. Stognienko, R. Timmermans, T. Wagner, C. Zehner.
Article co-ordinator: T. Wehr, ESA/ESTEC, Keplerlaan 1, 2200 AG Noordwijk,
The Netherlands, (Tobias.Wehr@esa.int)
References
[1] ESA, Envisat GOMOS, An Instrument for Global Atmospheric Ozone Monitoring, SP-1244, published by ESA Publications Division,
ESTEC, P.O. Box 299, 2200 AG Noordwijk, The Netherlands, May 2001.
[2] ESA, MIPAS, An Instrument for Atmospheric Chemistry and Climate Research, SP-1229, published by ESA Publications Division,
ESTEC, P.O. Box 299, 2200 AG Noordwijk, The Netherlands, March 2000.
[3] Bovensmann, H., J.P. Burrows, M. Buchwitz, J. Frerick, S. Noël, V.V. Rozanov, SCIAMACHY: Mission Objectives and
Measurement Modes, J. Atm. Sci., 52, pp 127-150, 1999.
Information on the internet: http://www.esa.int/ and http://envisat.esa.int/